

Question: Statistics question ind the standard deviation, s, of sample data summarized in the frequency distribution table below by using the formula below, where x represents
Statistics question
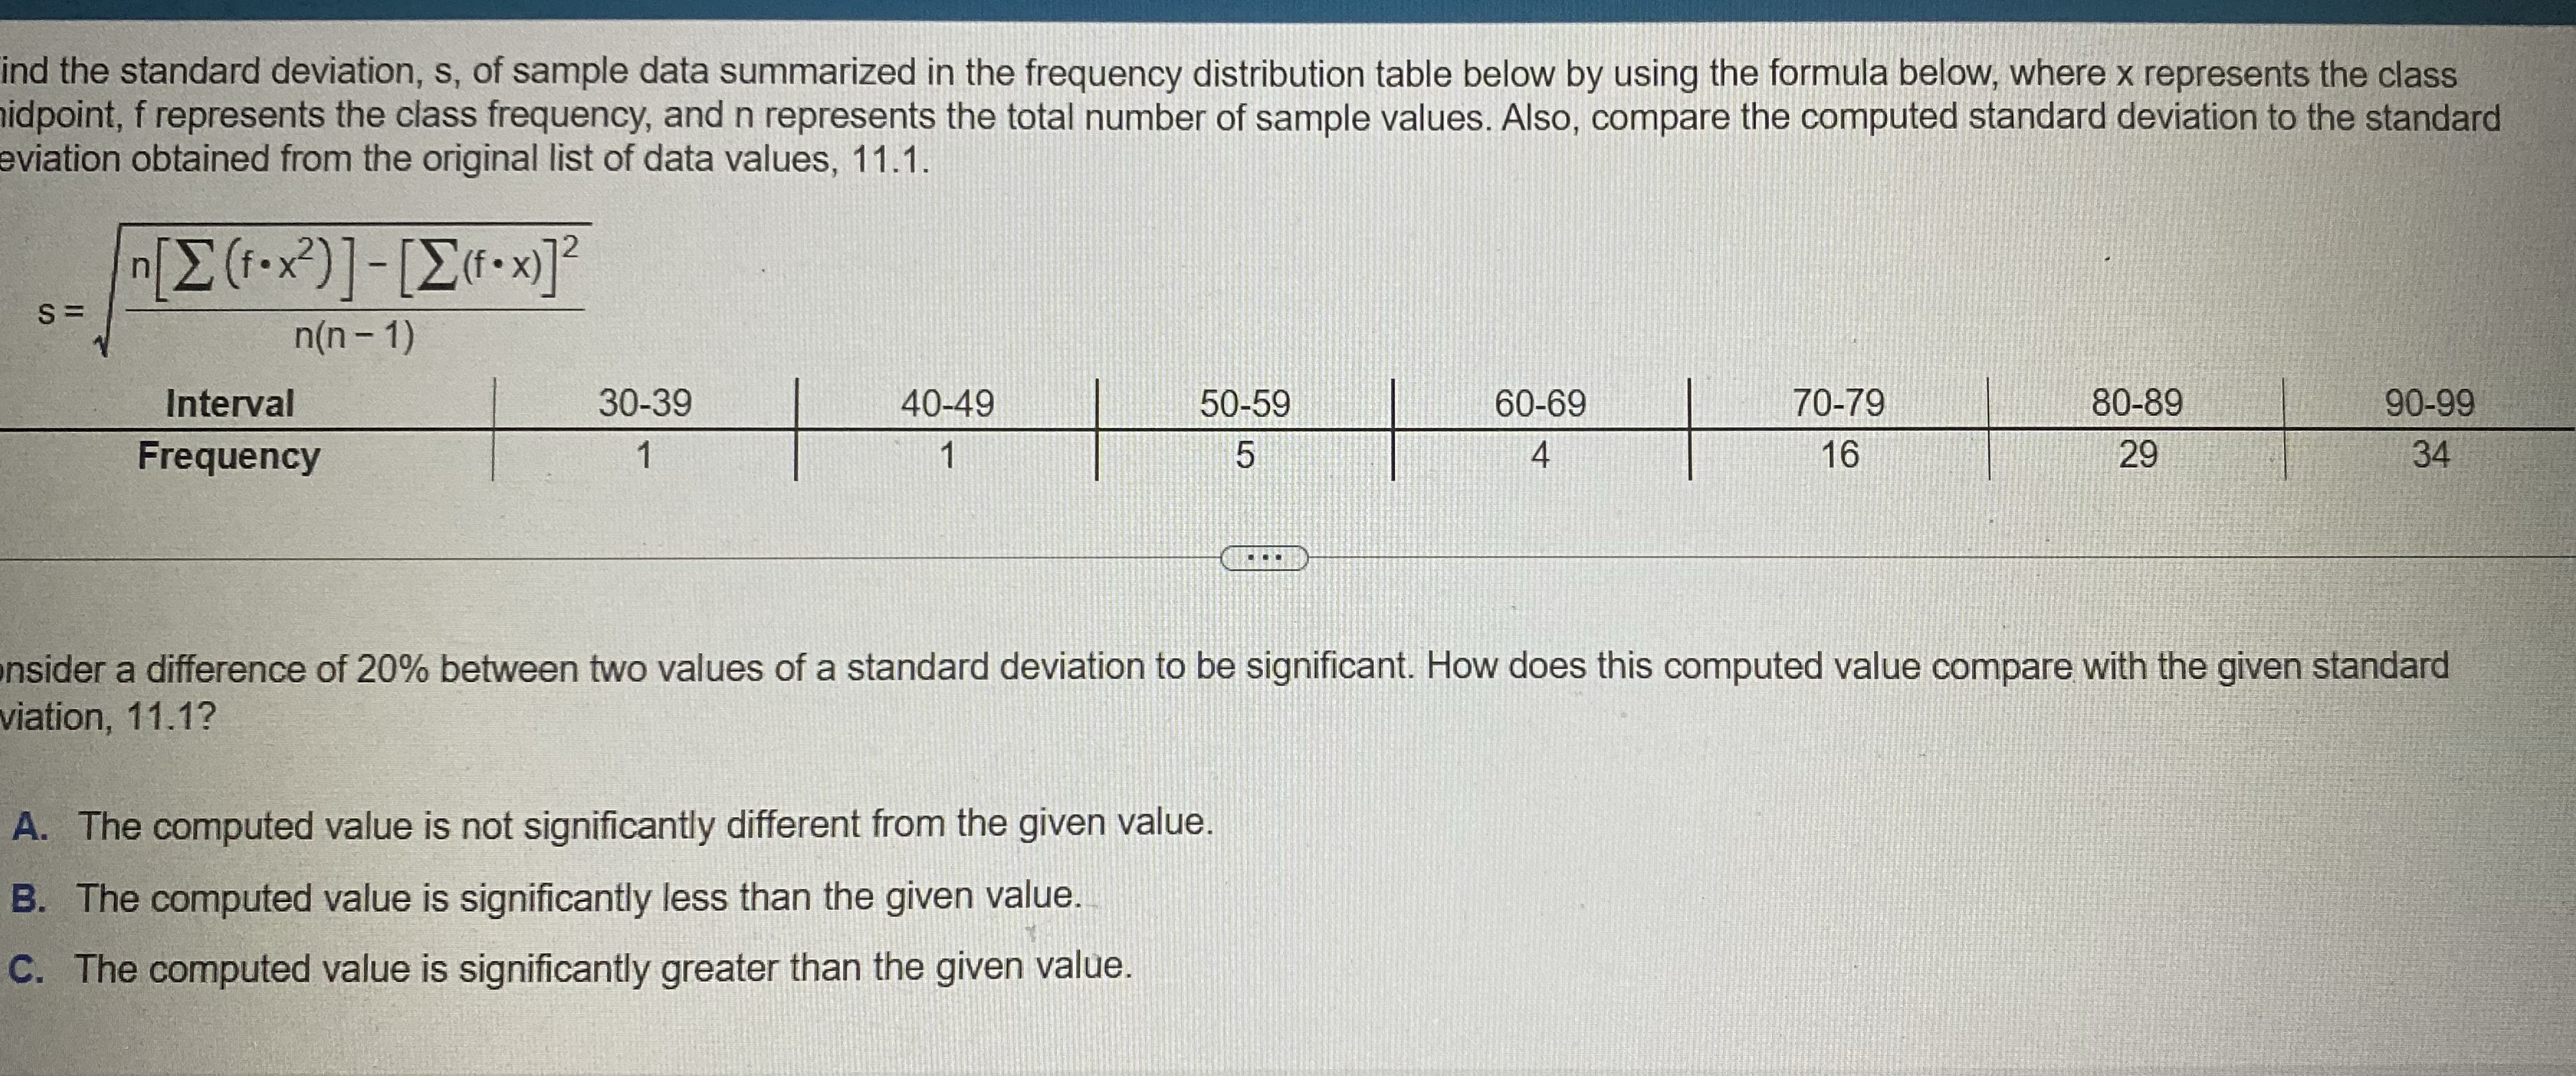
ind the standard deviation, s, of sample data summarized in the frequency distribution table below by using the formula below, where x represents the class idpoint, f represents the class frequency, and n represents the total number of sample values. Also, compare the computed standard deviation to the standard eviation obtained from the original list of data values, 11.1. [E (F . x 2 ) ] - [ [ (f . x ) ]2 S = n(n - 1) Interval 30-39 40-49 50-59 60-69 70-79 80-89 90-99 Frequency 5 4 16 29 34 nsider a difference of 20% between two values of a standard deviation to be significant. How does this computed value compare with the given standard viation, 11.1? A. The computed value is not significantly different from the given value. B. The computed value is significantly less than the given value. C. The computed value is significantly greater than the given value
Step by Step Solution
There are 3 Steps involved in it

Get step-by-step solutions from verified subject matter experts