

Question: statistics. Sample mean and mean table, table of sampling distribution, and histogram C. Direction: Create an Observation Sample Mean and Mean Table, Table of Sampling
statistics. Sample mean and mean table, table of sampling distribution, and histogram

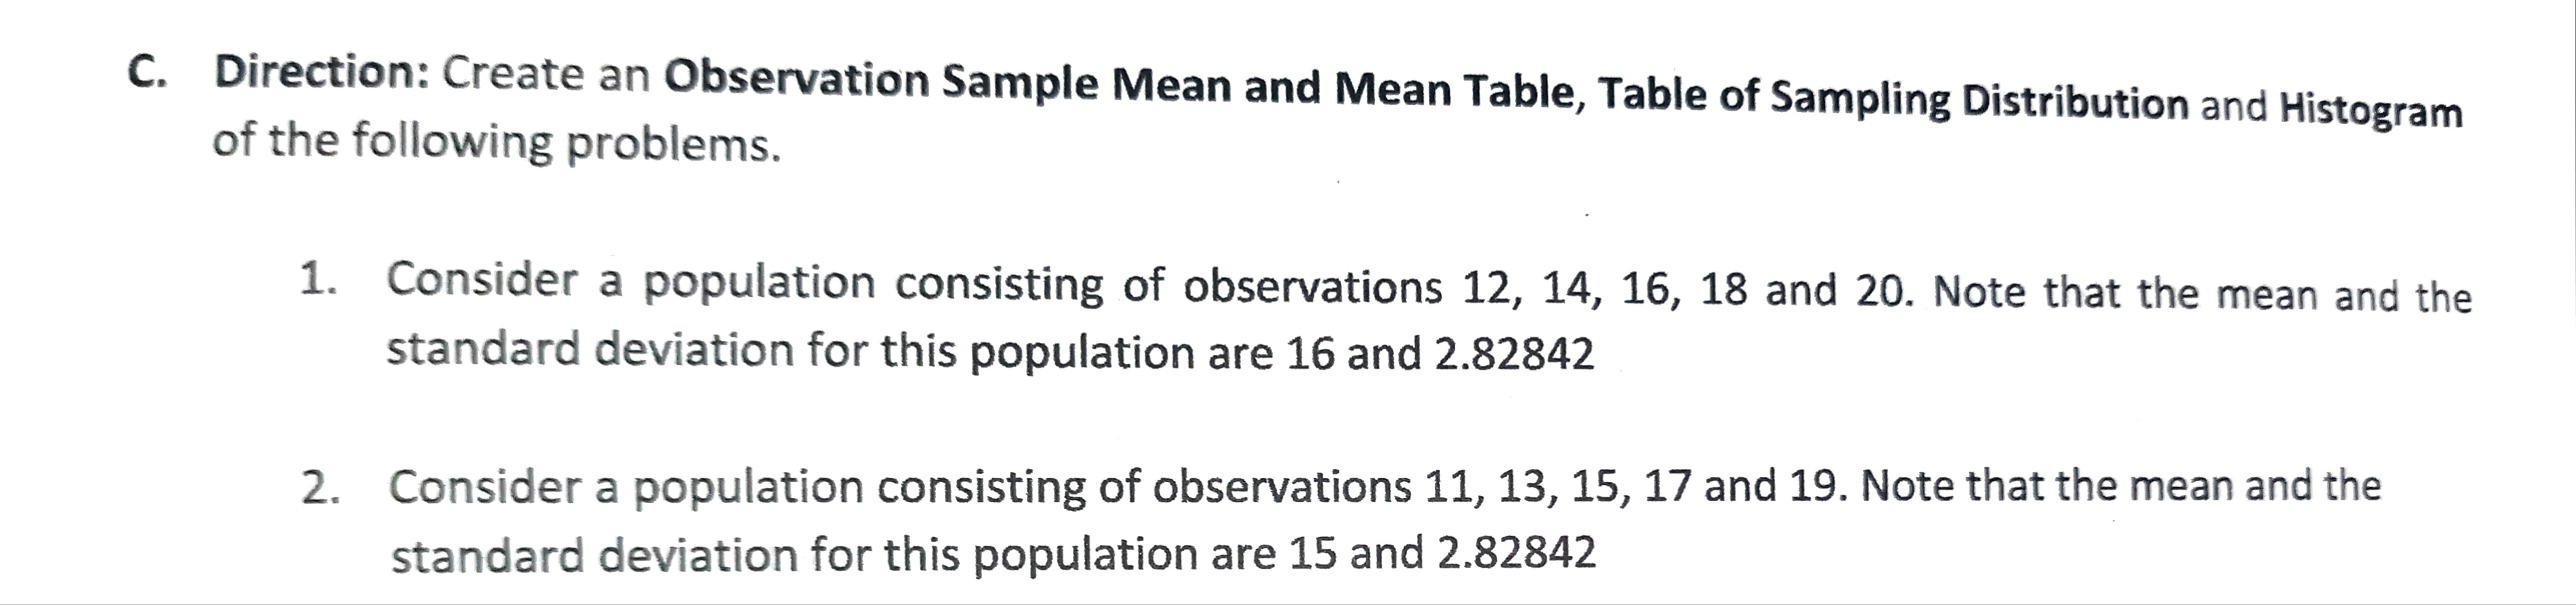
C. Direction: Create an Observation Sample Mean and Mean Table, Table of Sampling Distribution and Histogram of the following problems. Consider a population consisting of observations 12, 14, 16, 18 and 20. Note that the mean and the standard deviation for this population are 16 and 2.82842 2. Consider a population consisting of observations 11, 13, 15, 17 and 19. Note that the mean and the standard deviation for this population are 15 and 2.82842
Step by Step Solution
There are 3 Steps involved in it
1 Expert Approved Answer
Step: 1 Unlock

Question Has Been Solved by an Expert!
Get step-by-step solutions from verified subject matter experts
Step: 2 Unlock
Step: 3 Unlock