

Question: Statistics Section 04 Fall Semester 2021 CO MyOpenMath The dotplot below shows 2005 U.S. household income. Each dot represents half a million households. Each stack/column
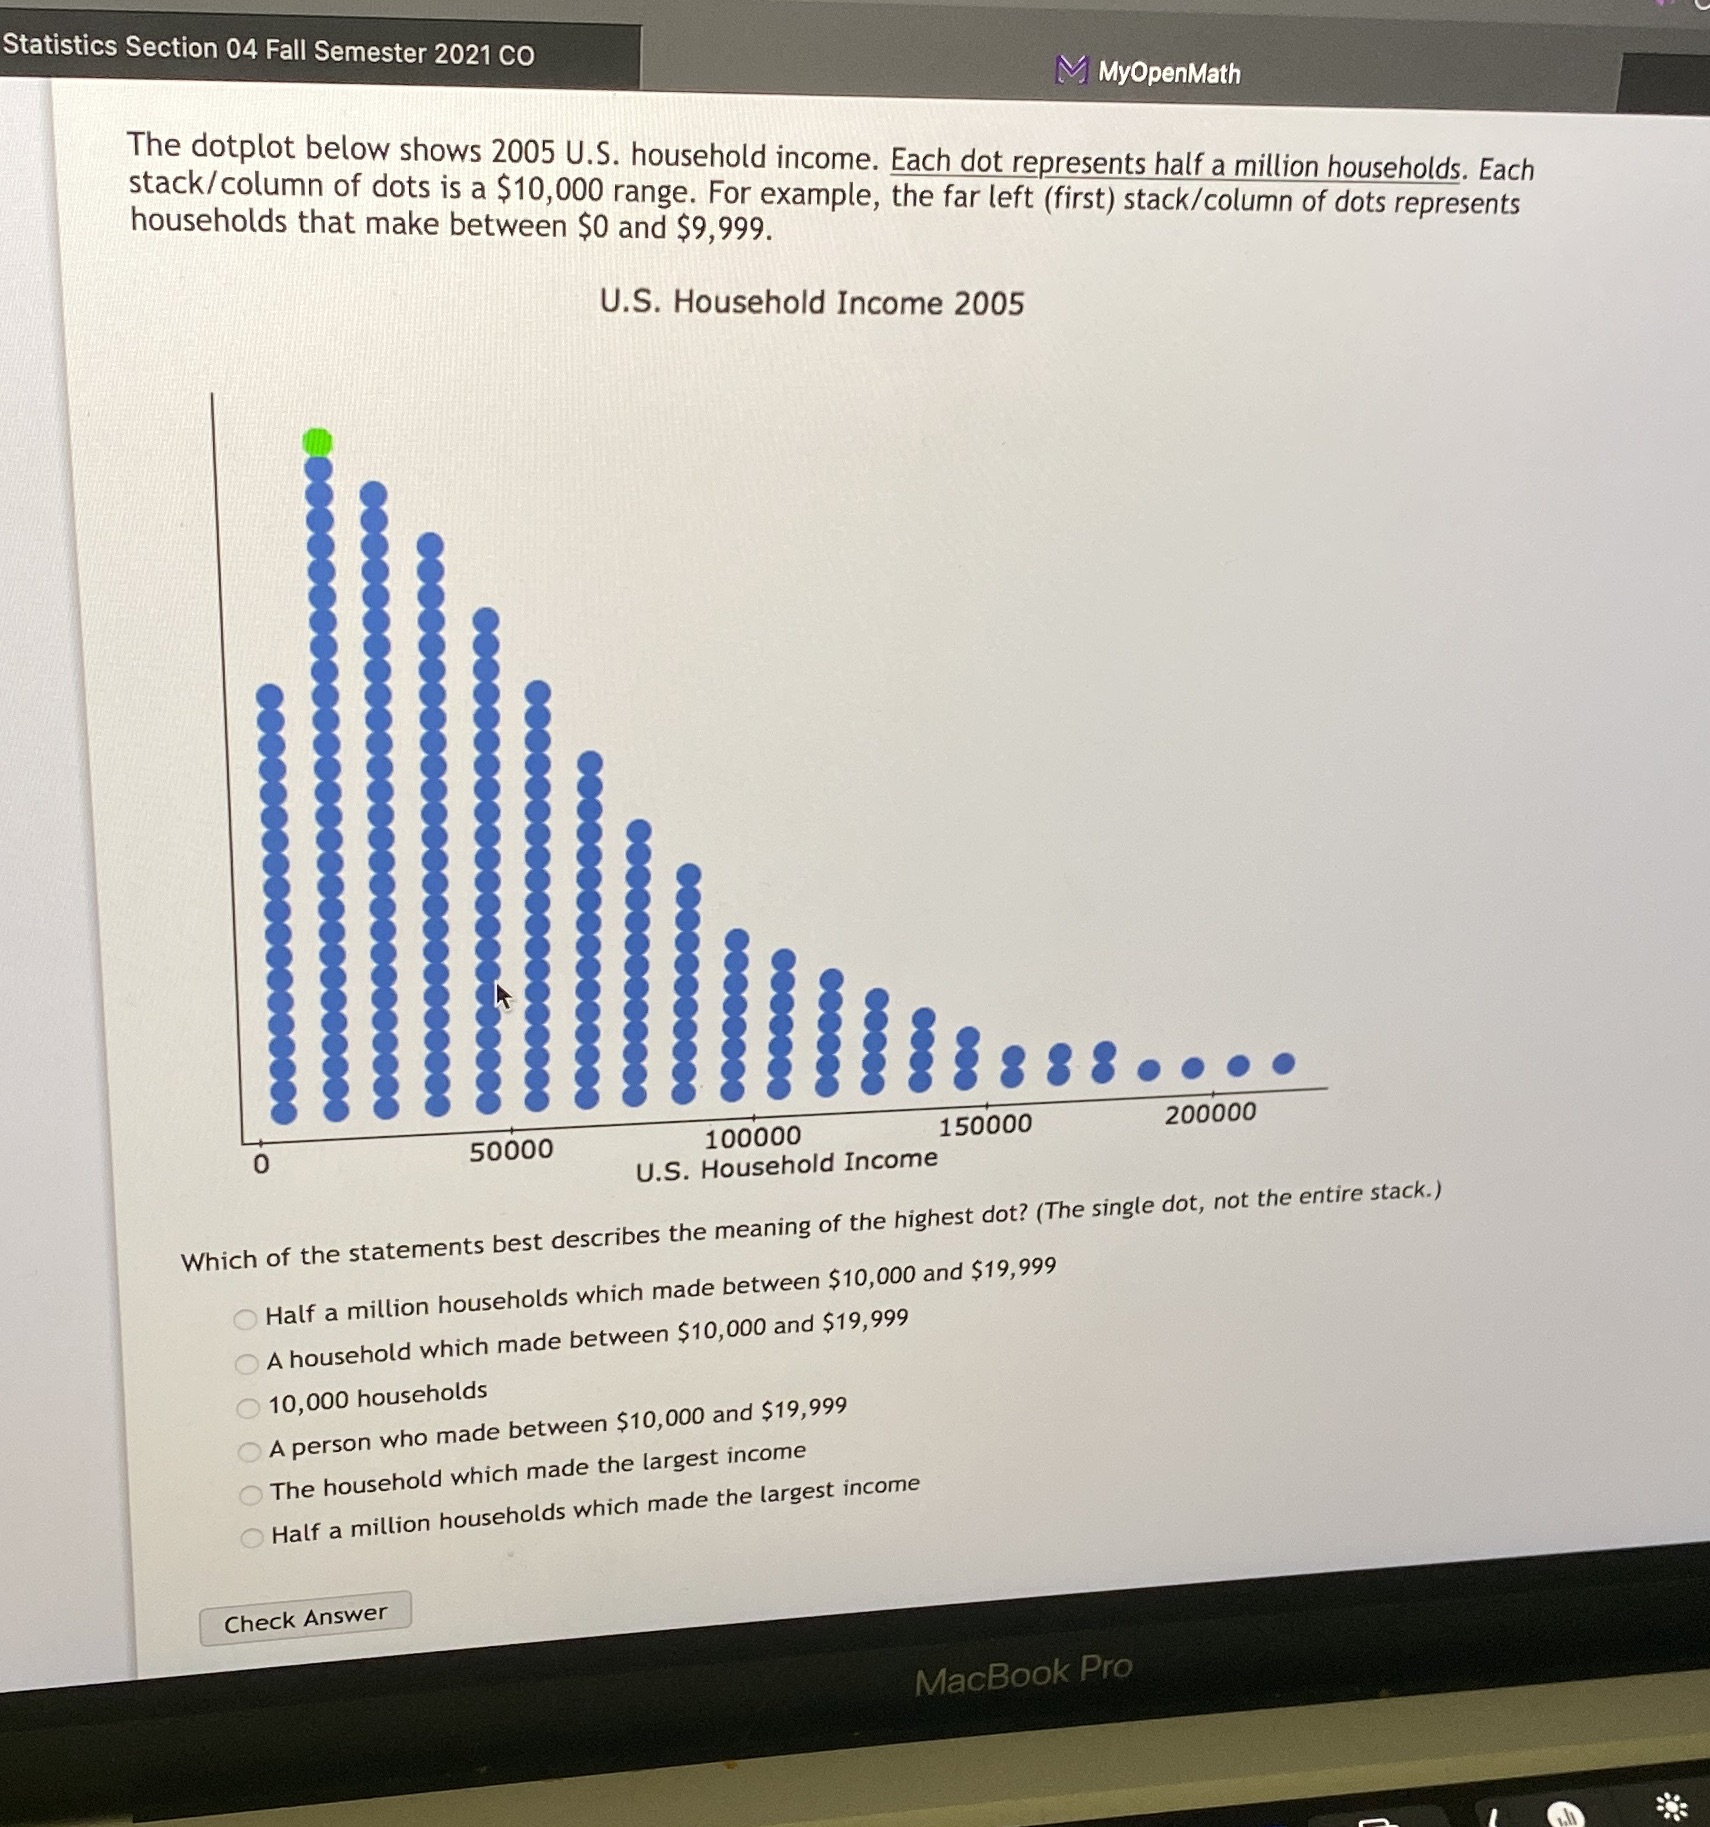
Statistics Section 04 Fall Semester 2021 CO MyOpenMath The dotplot below shows 2005 U.S. household income. Each dot represents half a million households. Each stack/column of dots is a $10,000 range. For example, the far left (first) stack/column of dots represents households that make between $0 and $9,999. U.S. Household Income 2005 100000 150000 200000 U.S. Household Income Which of the statements best describes the meaning of the highest dot? (The single dot, not the entire stack.) Half a million households which made between $10,000 and $19,999 A household which made between $10,000 and $19, 999 10,000 households A person who made between $10,000 and $19,999 The household which made the largest income Half a million households which made the largest income Check Answer MacBook Pro
Step by Step Solution
There are 3 Steps involved in it

Get step-by-step solutions from verified subject matter experts