

Question: STATISTICS SPSS There are only 3 questions to answer: 4) Verify the sales agent's claim using canonical discriminant analysis (use the stepwise method, in case


STATISTICS SPSS
There are only 3 questions to answer:
4) Verify the sales agent's claim using canonical discriminant analysis (use the stepwise method, in case there is correlation between any two independent variables) in SPSS (or any other software) and report your findings by answering the followingquestions:
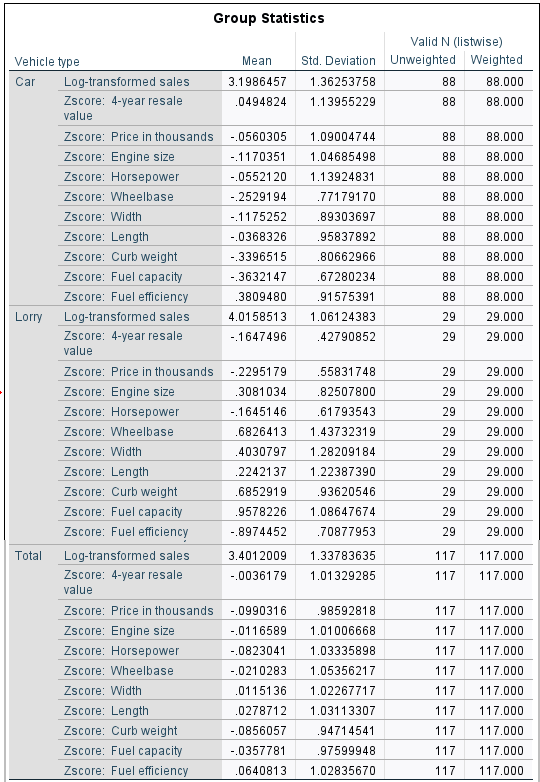
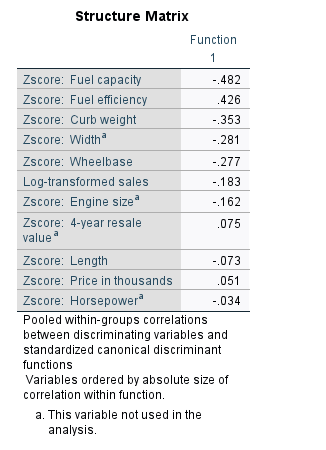
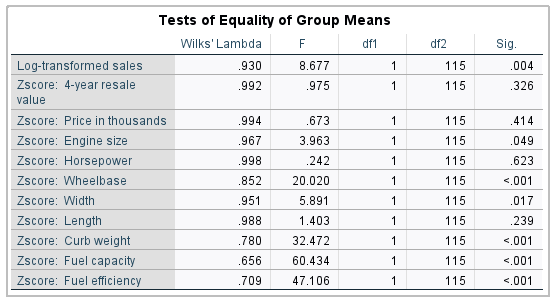
(i)List the attributes that are significantly different per vehicle type. Justify your answer (6+2 marks)
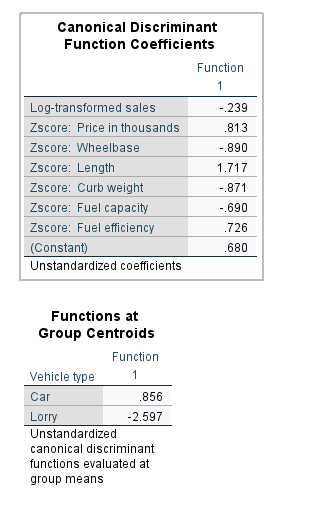
(iii)Does the discriminant model significantly differentiate the vehicles? Justify your answer. (1+3 marks)
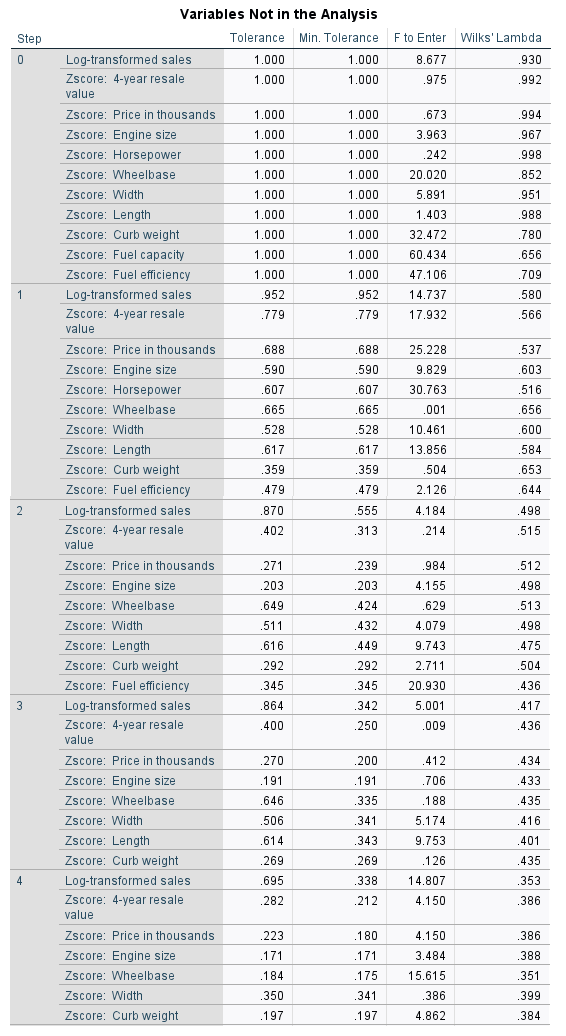
(iv)Are all variables significant in the model? (3 marks)
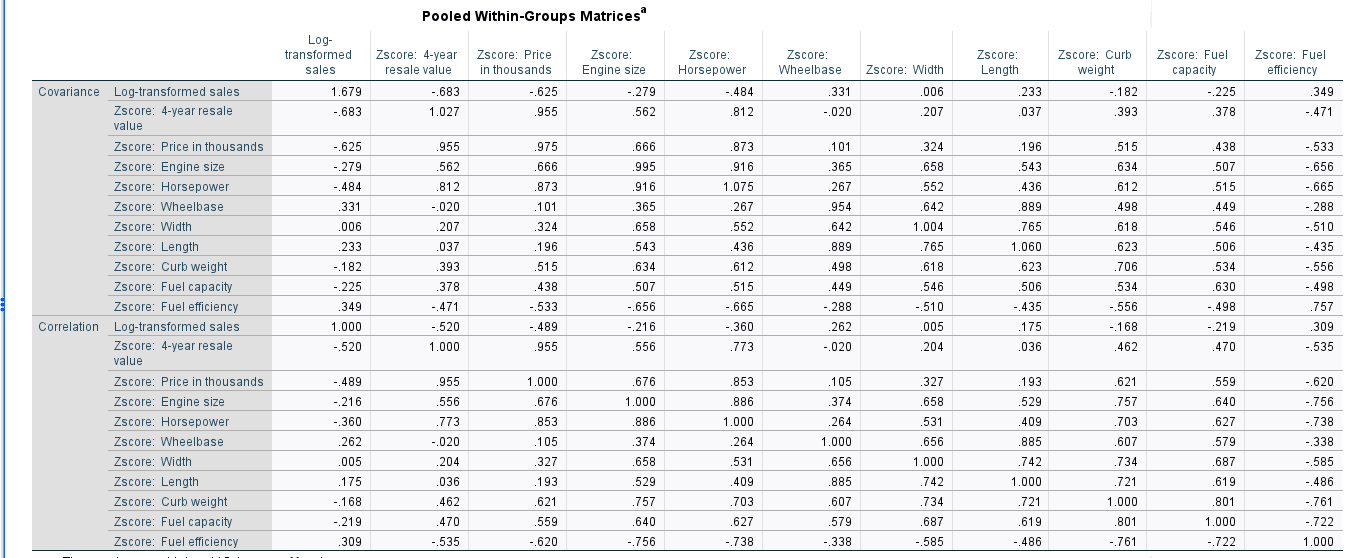
Make use of the following outputs in order to answer the 3 questions above:
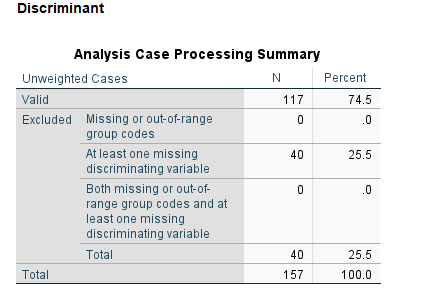
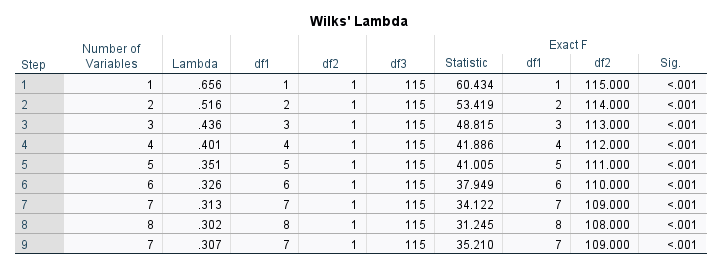
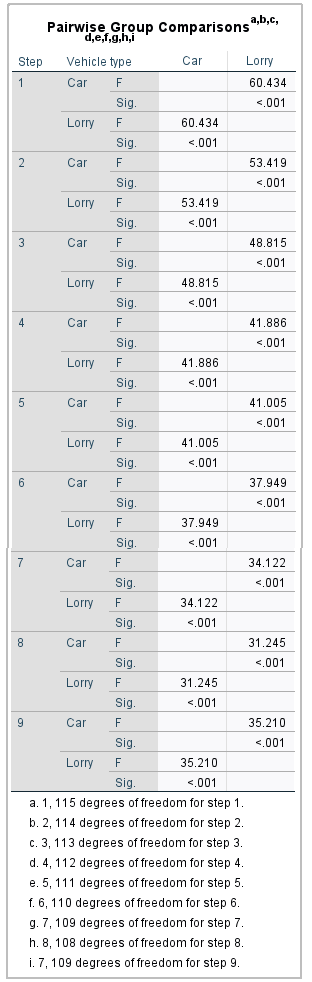
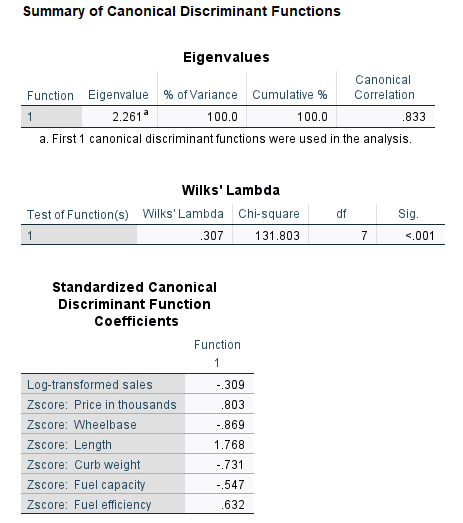

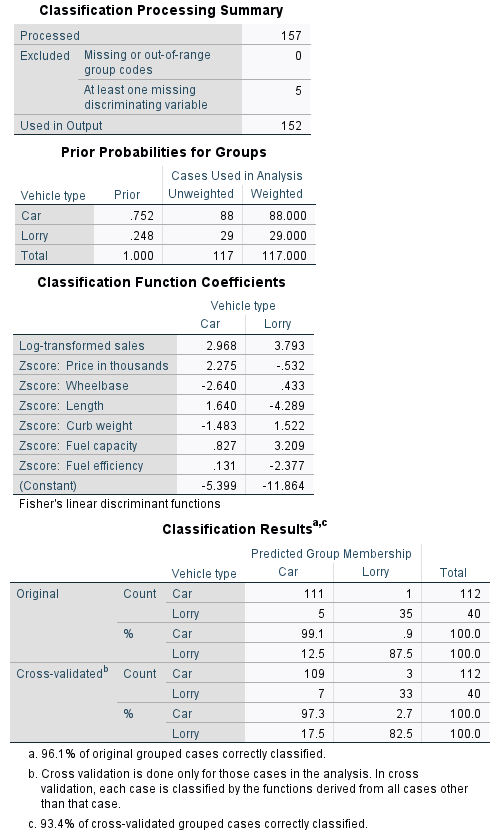


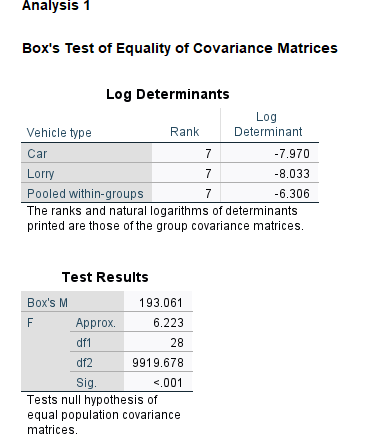
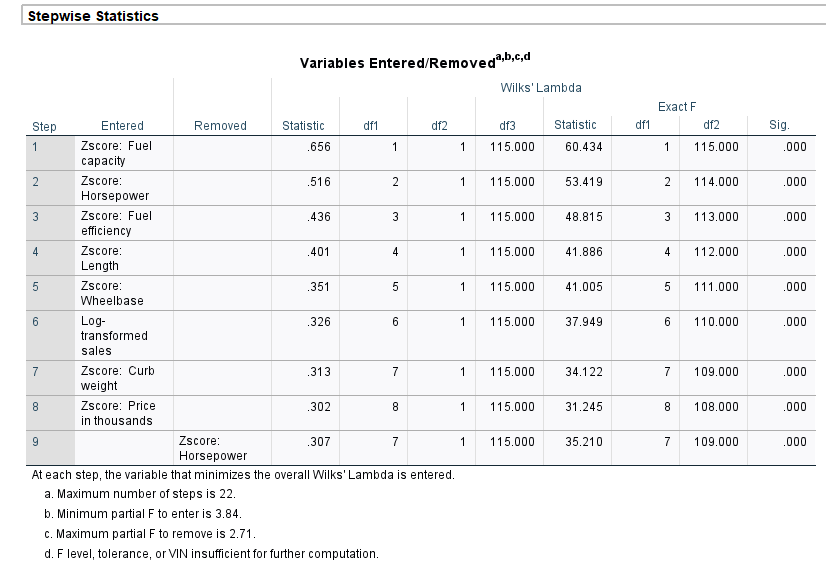
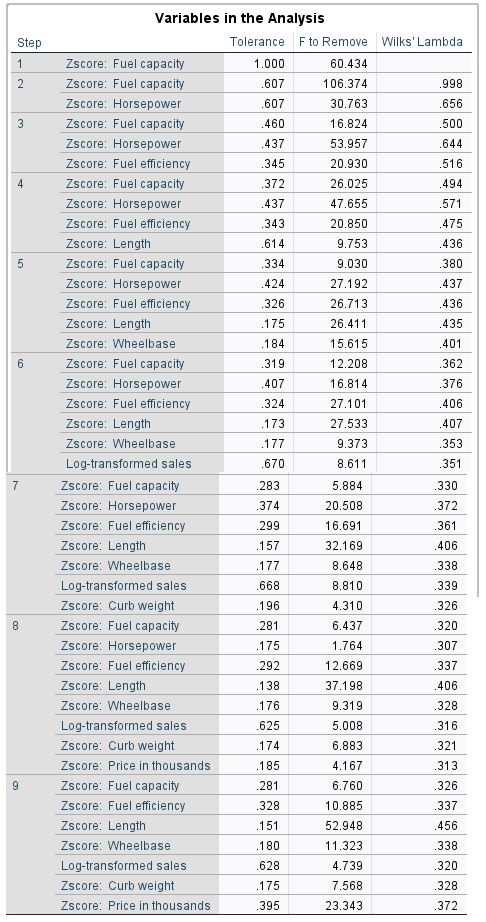

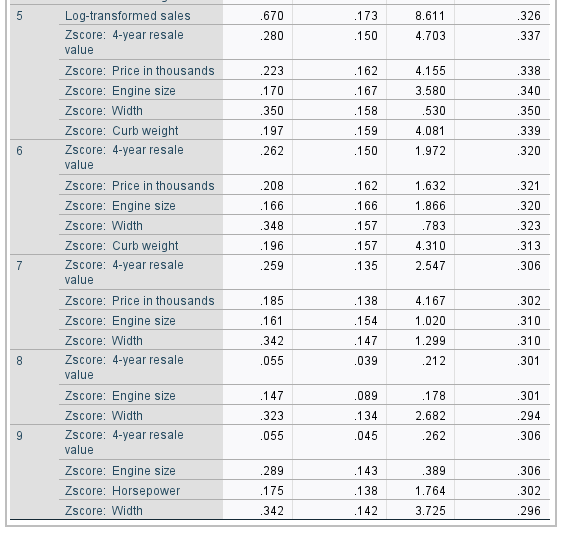
Discriminant Analysis Case Processing Summary Unweighted Cases N Percent Valid 117 74.5 Excluded Missing or out-of-range group codes At least one missing 40 25.5 discriminating variable Both missing or out-of- .0 range group codes and at least one missing discriminating variable Total 40 25.5 Total 157 100.0Wilks' Lambda Number of Exact F Step Variables Lambda df1 df2 df3 Statistic df1 df2 Sig 1 .656 1 1 115 60.434 115.000 <.001 .516 .351 .326 .313 co .302 .307 group comparisons d step vehicle type car lorry f sig. sig a. degrees of freedom for b. c. d. e. f. g. h. i. canonical discriminant functions eigenvalues function eigenvalue variance cumulative correlation first were used in the analysis. wilks lambda test chi-square df standardized coefficients log-transformed sales zscore: price thousands .803 wheelbase length curb weight fuel capacity efficiency .632 unstandardized at centroids evaluated meansclassification processing summary processed excluded missing or out-of-range codes least one discriminating variable output prior probabilities groups cases analysis unweighted weighted total classification fisher linear results predicted membership original count .9 cross-validated grouped correctly classified. cross validation is done only those each case classified by derived from all other than that case. classified.group statistics valid n mean std. deviation resale value engine size horsepower width .89303697 .80662966 .91575391 .42790852 .55831748 .82507800 .2242137 .93620546 .0115136 .97599948 equality means df1 df2 .004 .992 .994 .673 .414 .967 .852 .988 within-groups matrices log- transformed covariance ..625 .182 .225 .812 .037 .378 .873 .279 .666 .533 .656 ..665 .233 .196 .515 .556 .349 .665 .288 ..510 .435 .757 .. .520 .219 .773 .470 .327 .620 .658 .360 .262 .738 .105 .734 .687 .585 .721 .801 .486 box log determinants rank determinant pooled ranks and natural logarithms printed are matrices. m approx. tests null hypothesis equal population matrices.stepwise variables entered exact removed statistic df3 minimizes overall entered. maximum number steps minimum partial to enter remove level tolerance vin insufficient further computation.variables .345 .372 .437 .343 .334 .173 .177 .339 .138 .176 .328 .395 .372variables not min. .242 .779 .566 .688 .359 .402 .214 .649 .511 .432 .616 .292 .504 .864 .400 .250 .436 .270 .191 .706 .188 .506 .341 .695 .223 .388 .184 .197 .150 .350 .310 .055 .342 .142 .296>
Step by Step Solution
There are 3 Steps involved in it

Get step-by-step solutions from verified subject matter experts