

Question: Statistics Test C F2021 For full marks, show your work and use two decimal places, unless stated otherwise. 1. Sample data was collected from an
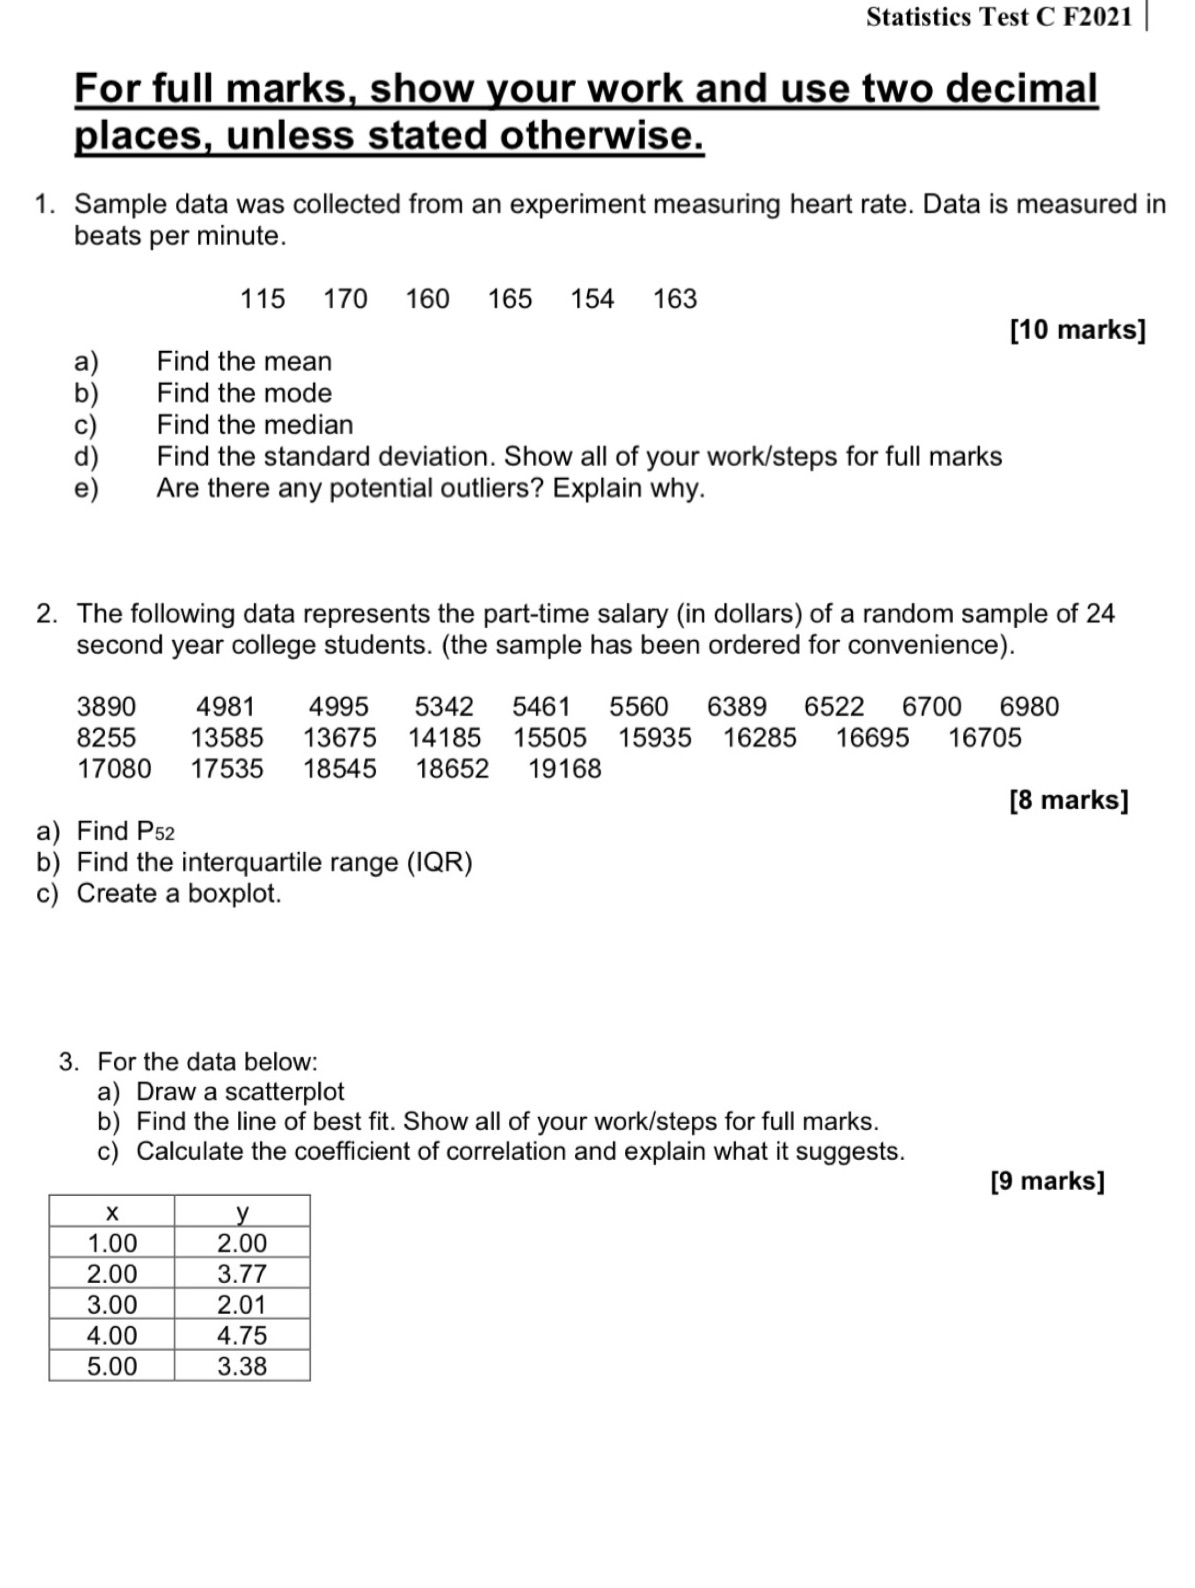
Statistics Test C F2021 For full marks, show your work and use two decimal places, unless stated otherwise. 1. Sample data was collected from an experiment measuring heart rate. Data is measured in beats per minute. 115 170 160 165 154 163 [10 marks] Find the mean Find the mode Find the median Find the standard deviation. Show all of your work/steps for full marks Are there any potential outliers? Explain why. 2. The following data represents the part-time salary (in dollars) of a random sample of 24 second year college students. (the sample has been ordered for convenience). 3890 4981 4995 5342 5461 5560 6389 6522 6700 6980 8255 13585 13675 14185 15505 15935 16285 16695 16705 17080 17535 18545 18652 19168 [8 marks] a) Find P52 b) Find the interquartile range (IQR) c) Create a boxplot. 3. For the data below: a) Draw a scatterplot b) Find the line of best fit. Show all of your work/steps for full marks. c) Calculate the coefficient of correlation and explain what it suggests. [9 marks] X y 1.00 2.00 2.00 3.77 3.00 2.01 4.00 4.75 5.00 3.38
Step by Step Solution
There are 3 Steps involved in it

Get step-by-step solutions from verified subject matter experts