

Question: statistics Using a discount travel website, the prices for a oneway flight from one city to various other cities were recorded. The following table gives
statistics
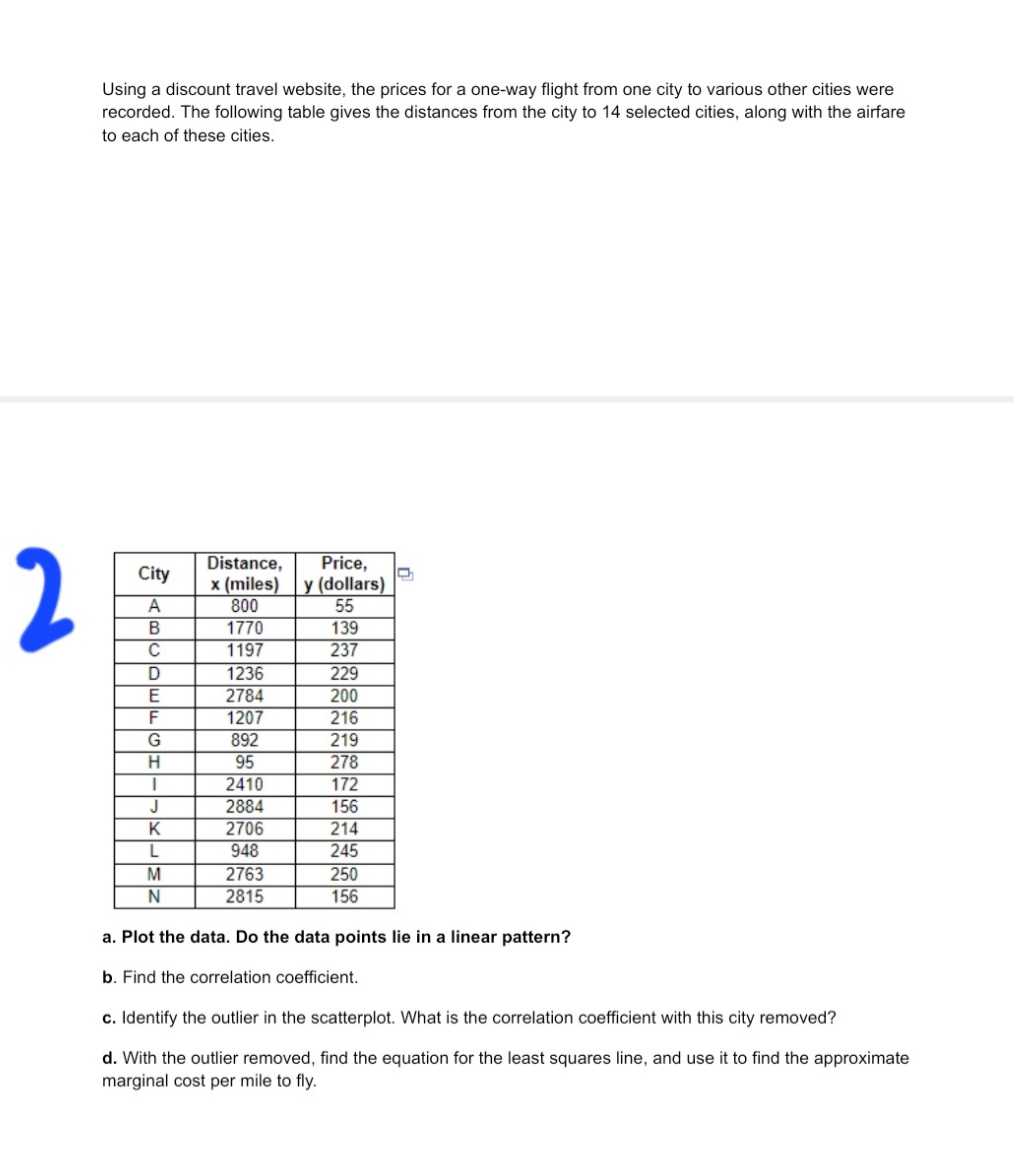
Using a discount travel website, the prices for a oneway flight from one city to various other cities were recorded. The following table gives the distances from the city to 14 selected cities, along with the airfare to each of these cities. Distance. Price, 1: {miles} {dollars} a. Plot the data. Do the data points lie in a linear pattern? b. Find the correlation coefcient. 0. Identify the outlier in the scatterplott What is the correlation coefficient with this city removed? d. With the outlier removed. nd the equation for the least squares line. and use it to nd the approximate marginal cost per mile to fly
Step by Step Solution
There are 3 Steps involved in it
1 Expert Approved Answer
Step: 1 Unlock

Question Has Been Solved by an Expert!
Get step-by-step solutions from verified subject matter experts
Step: 2 Unlock
Step: 3 Unlock