

Question: stats 119 Critical Values of the Pearson Correlation Coefficient r n 0 = 0.05 D = 0.01 NOTE: To test Ho: p = 0 0.950
stats 119
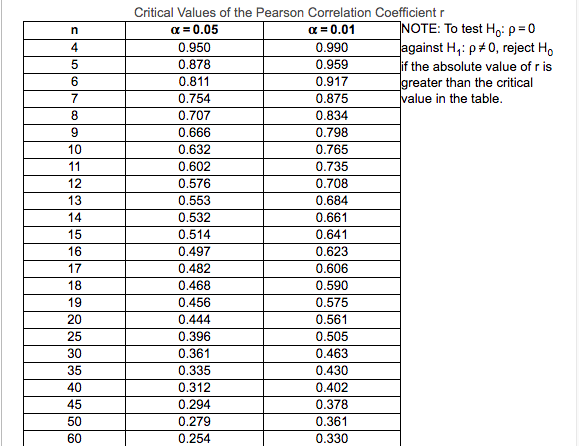
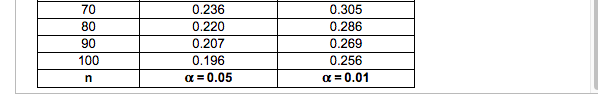
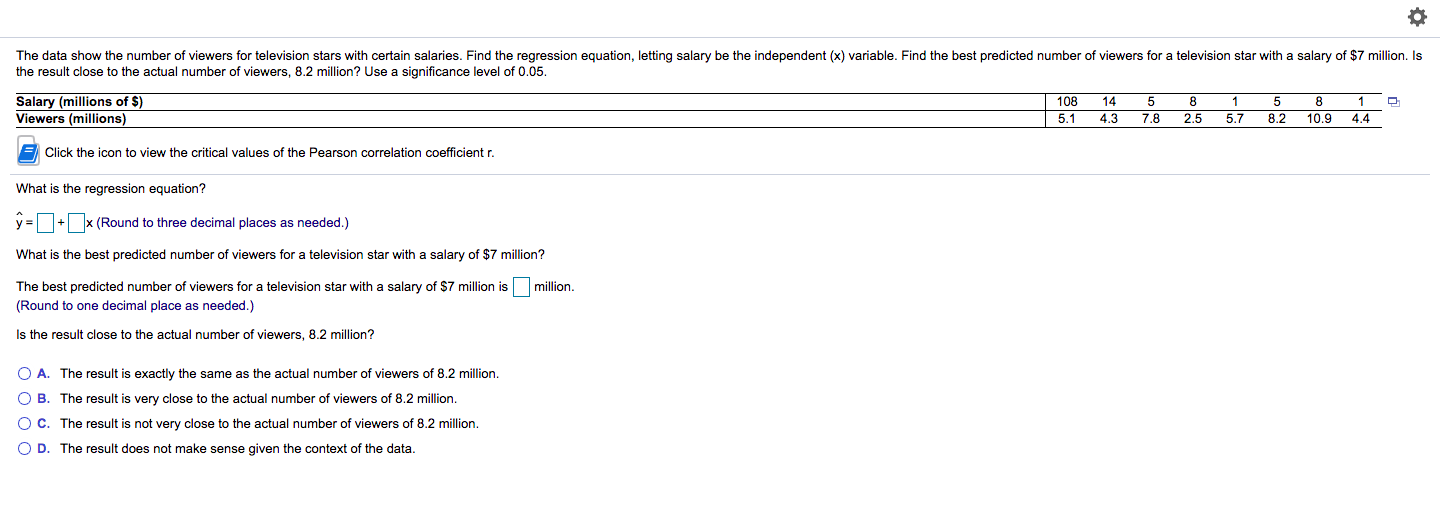
Critical Values of the Pearson Correlation Coefficient r n 0 = 0.05 D = 0.01 NOTE: To test Ho: p = 0 0.950 0.990 against Hy: p #0, reject Ho 0.878 0.959 f the absolute value of r is 6 0.811 0.917 greater than the critical 0.754 0.875 value in the table. 0.707 0.834 9 0.666 0.798 10 0.632 0.765 11 0.602 0.735 12 0.576 0.708 13 0.553 0.684 14 0.532 0.661 15 0.514 0.641 16 0.497 0.623 17 0.482 0.606 18 0.468 0.590 19 0.456 0.575 20 0.444 0.561 25 0.396 0.505 30 0.361 0.463 35 0.335 0.430 40 0.312 0.402 45 0.294 0.378 50 0.279 0.361 60 0.254 0.330\fThe data show the number of viewers for television stars with certain salaries. Find the regression equation, letting salary be the independent (x) variable. Find the best predicted number of viewers for a television star with a salary of $7 million. Is the result close to the actual number of viewers, 8.2 million? Use a significance level of 0.05. Salary (millions of $) 108 14 5 8 1 5 8 1 Viewers (millions) 5.1 4.3 7.8 2.5 5.7 8.2 10.9 4.4 Click the icon to view the critical values of the Pearson correlation coefficient r. What is the regression equation? y=[+*(Round to three decimal places as needed.) What is the best predicted number of viewers for a television star with a salary of $7 million? The best predicted number of viewers for a television star with a salary of $7 million is million. (Round to one decimal place as needed.) Is the result close to the actual number of viewers, 8.2 million? O A. The result is exactly the same as the actual number of viewers of 8.2 million. O B. The result is very close to the actual number of viewers of 8.2 million. O C. The result is not very close to the actual number of viewers of 8.2 million. O D. The result does not make sense given the context of the data
Step by Step Solution
There are 3 Steps involved in it

Get step-by-step solutions from verified subject matter experts