

Question: stats and prob The graph of an exponential function is shown in the figure below. The horizontal asymptote is shown as a dashed line. Find
stats and prob
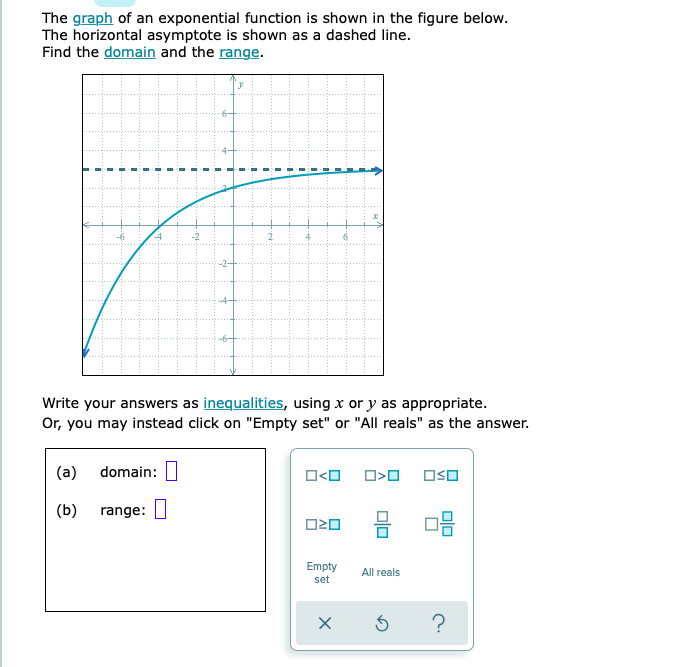
The graph of an exponential function is shown in the figure below. The horizontal asymptote is shown as a dashed line. Find the domain and the range. ....5 .....5.. .. ...... ... ....;... . . ...... ...... .....4- ..... ...:... .... ... -6 -2 . . . . . . . . . . . . . . .. . . .." . . ...".. ..... . .. . . . .. .; . .. . .; . .. .... ... ... ... .... ... Write your answers as inequalities, using x or y as appropriate. Or, you may instead click on "Empty set" or "All reals" as the answer. (a) domain: 0O OSO (b) range: 020 Empty All reals set X 5
Step by Step Solution
There are 3 Steps involved in it
1 Expert Approved Answer
Step: 1 Unlock

Question Has Been Solved by an Expert!
Get step-by-step solutions from verified subject matter experts
Step: 2 Unlock
Step: 3 Unlock