

Question: stats homework help 10. The data below gives student GPA and a measure of their achievement motivation on a scale from 1 to 100. Use
stats homework help
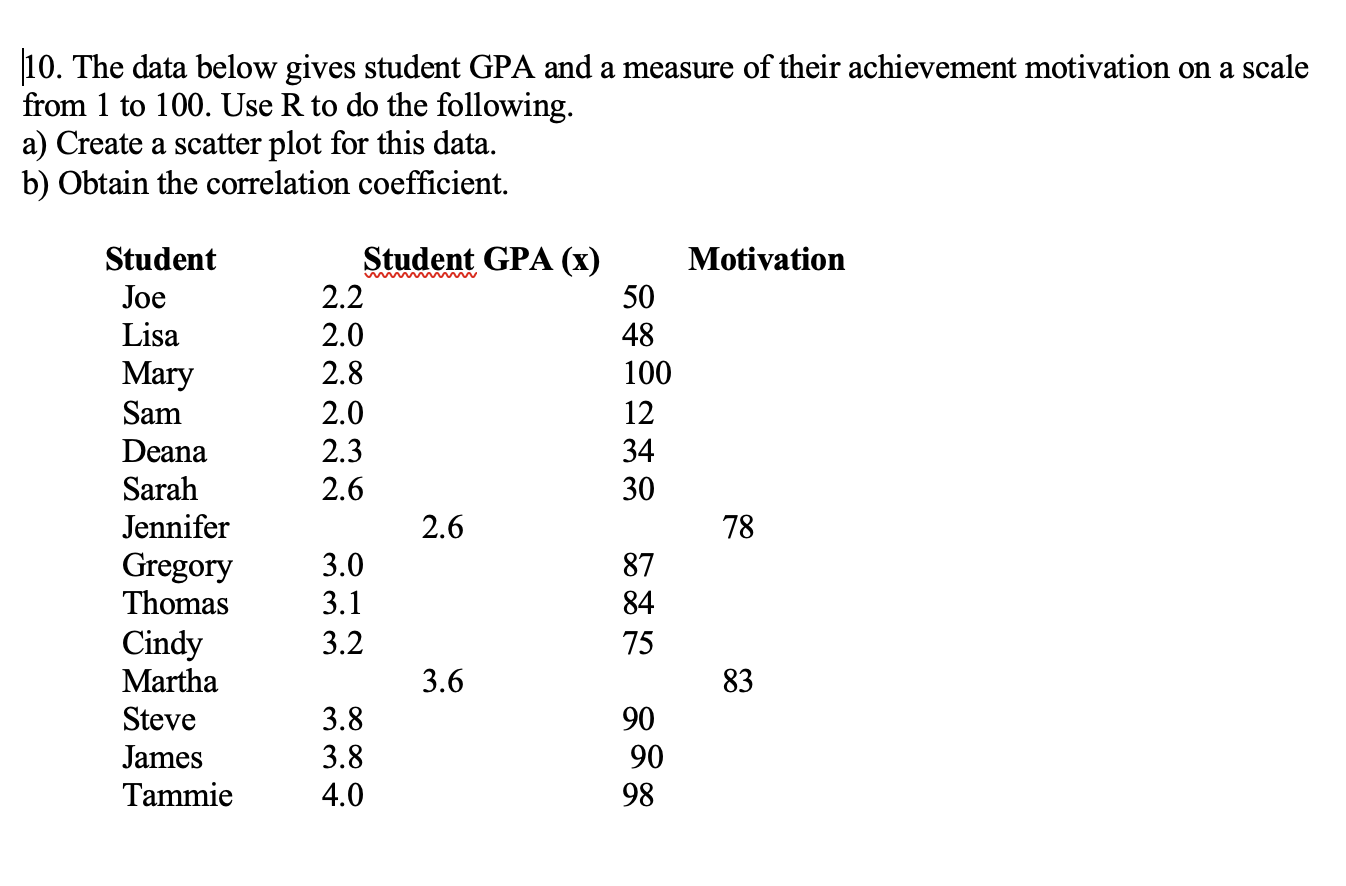
10. The data below gives student GPA and a measure of their achievement motivation on a scale from 1 to 100. Use R to do the following. a) Create a scatter plot for this data. b) Obtain the correlation coefficient. Student Student GPA (x) Motivation Joe 2.2 50 Lisa 2.0 48 Mary 2.8 100 Sam 2.0 12 Deana 2.3 34 Sarah 2.6 30 Jennifer 2.6 78 Gregory 3.0 87 Thomas 3.1 84 Cindy 3.2 75 Martha 3.6 83 Steve 3.8 90 James 3.8 90 Tammie 4.0 98
Step by Step Solution
There are 3 Steps involved in it
1 Expert Approved Answer
Step: 1 Unlock

Question Has Been Solved by an Expert!
Get step-by-step solutions from verified subject matter experts
Step: 2 Unlock
Step: 3 Unlock