

Question: stats is the question while d1 to d15 are the data set respectively all data is complete pls help i dont understand pls look through
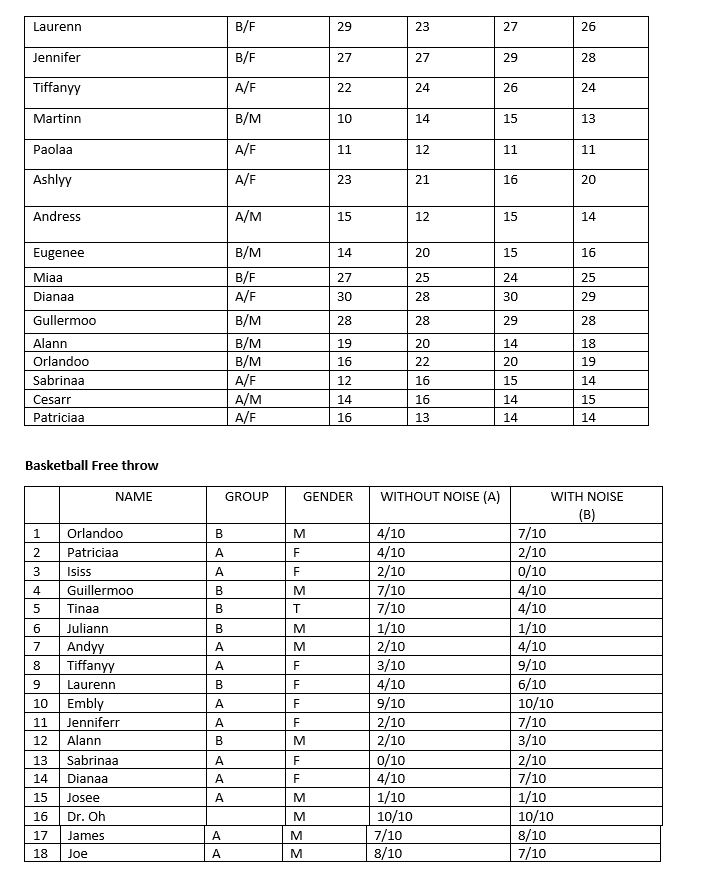
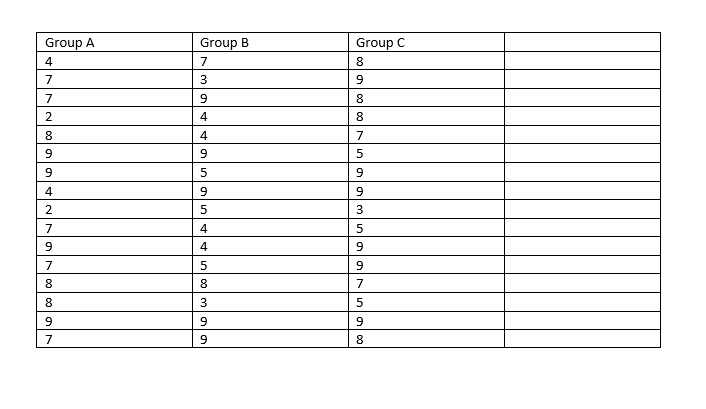
![Name of the test: Speed shooting [basketball] Group A Group B Group](https://s3.amazonaws.com/si.experts.images/answers/2024/06/6678492f7e143_0876678492f69f73.jpg)

![students only 3; using avg as 3:] WW )i[observed scores of test:](https://s3.amazonaws.com/si.experts.images/answers/2024/06/66784931eafa9_08966784931cd7f9.jpg)
![all 3 trials] Percentile rank scores 1. Please calculate the standard deviation,](https://s3.amazonaws.com/si.experts.images/answers/2024/06/6678493274258_090667849325a000.jpg)
![3: 0:13] from any 1 test and display all the scores on](https://s3.amazonaws.com/si.experts.images/answers/2024/06/6678493362ecc_09166784933480a1.jpg)
![the tables [you need 2 different tables [A a B] 2. Develop](https://s3.amazonaws.com/si.experts.images/answers/2024/06/66784933e22e7_09166784933c6220.jpg)
stats is the question while d1 to d15 are the data set respectively all data is complete pls help i dont understand
pls look through it again this is my last attempt nothing is missing
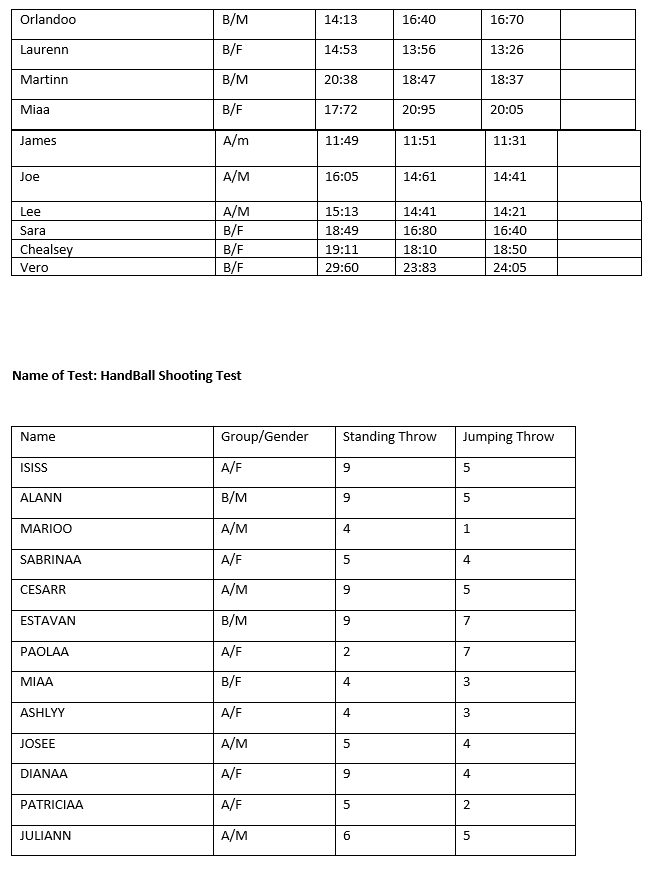
![2[rIIs]. m Vollevhall Ex} Basketball W] _ 3. Draw the scattergrams of](https://s3.amazonaws.com/si.experts.images/answers/2024/06/6678493535508_093667849351e9cd.jpg)
![correlations between skill test scores you choose {using average scores] and interpret](https://s3.amazonaws.com/si.experts.images/answers/2024/06/667849359c641_093667849358454b.jpg)

![any 2 groups from any test: using average] 1. Develop the data](https://s3.amazonaws.com/si.experts.images/answers/2024/06/667849367f6c4_09466784936654c2.jpg)
![symbols. 2. TestStatistic [the t-ratio]. Determine the degrees of freedom. 3. Refer](https://s3.amazonaws.com/si.experts.images/answers/2024/06/667849375c21f_0956678493739761.jpg)

![nal conclusion. Ill. Dependent T [T-test for paired] Pick a group [A](https://s3.amazonaws.com/si.experts.images/answers/2024/06/667849389bc0c_0966678493889f3b.jpg)
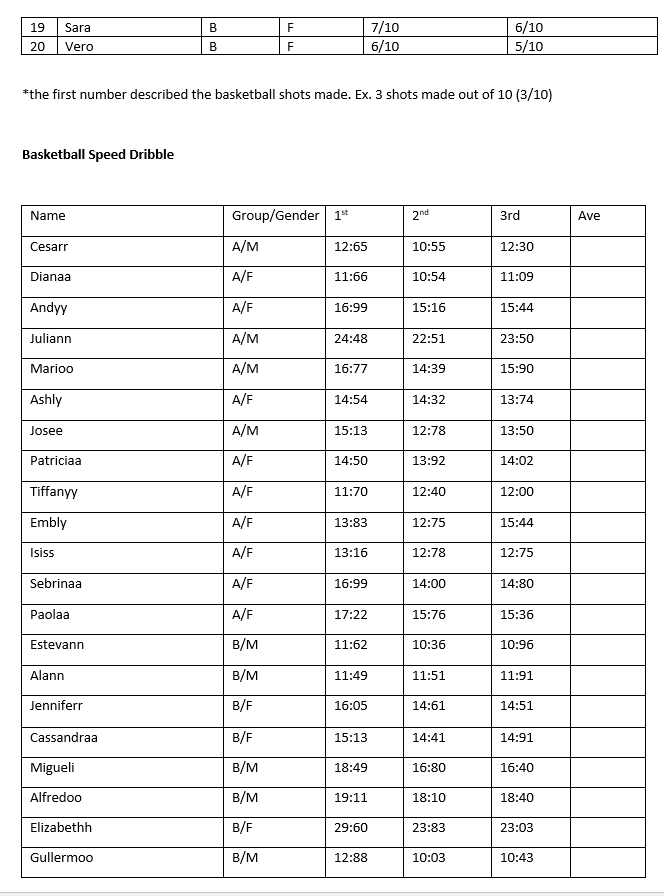
![or B] Shooting without noise Shooting with noise D [Difference] 1. Develop](https://s3.amazonaws.com/si.experts.images/answers/2024/06/667849391024a_09666784938f2582.jpg)
![hypotheses including symbols. 2. TestStatistic [the t-ratio]. Determine the degrees of freedom.](https://s3.amazonaws.com/si.experts.images/answers/2024/06/6678493a1365d_09766784939e6c8c.jpg)
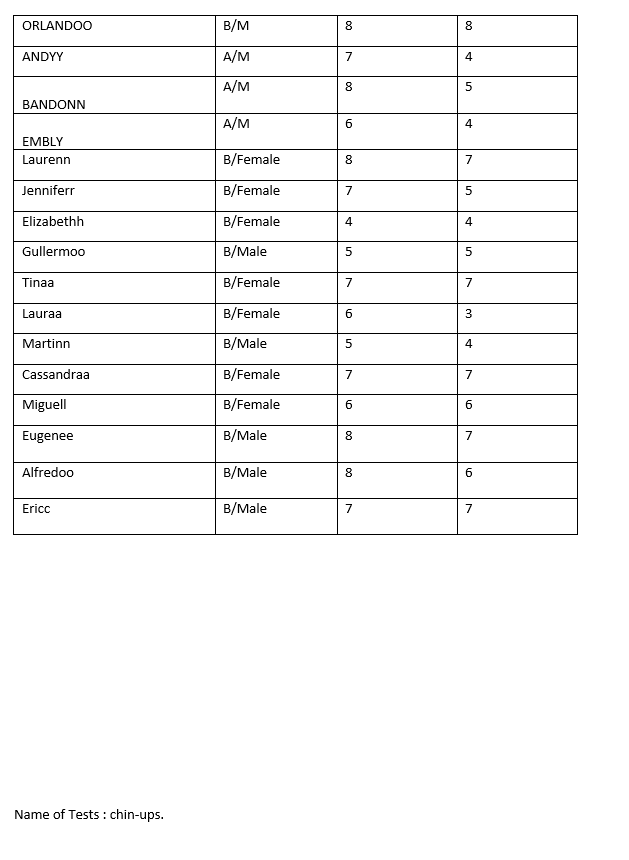
![make the nal conclusion. \"I. ANDVA [Repeated Measure] test [use one of](https://s3.amazonaws.com/si.experts.images/answers/2024/06/6678493b743b6_0996678493b5565a.jpg)
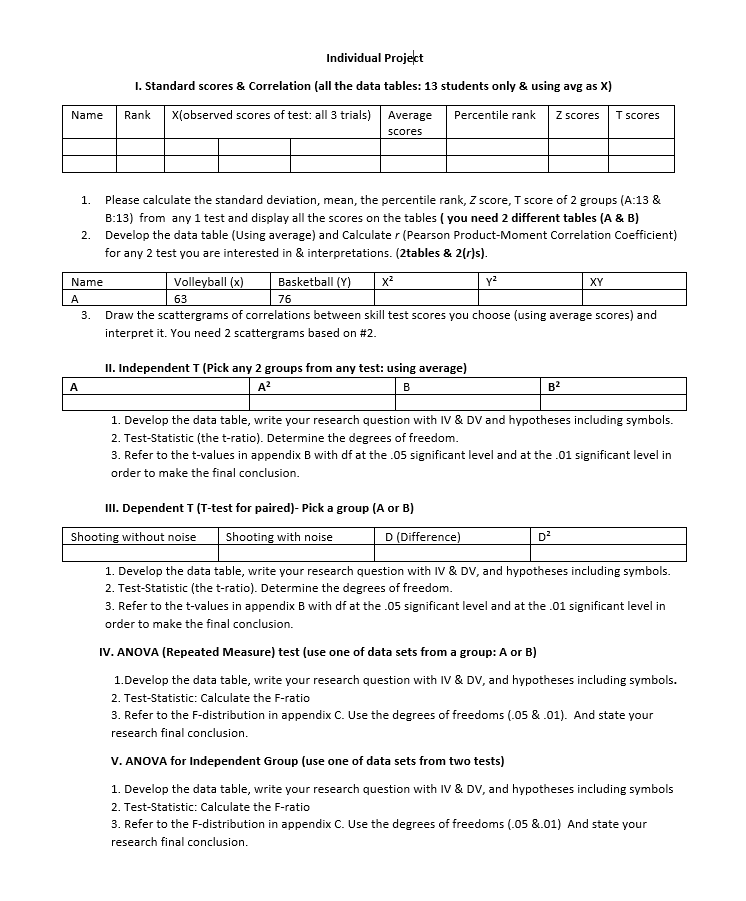
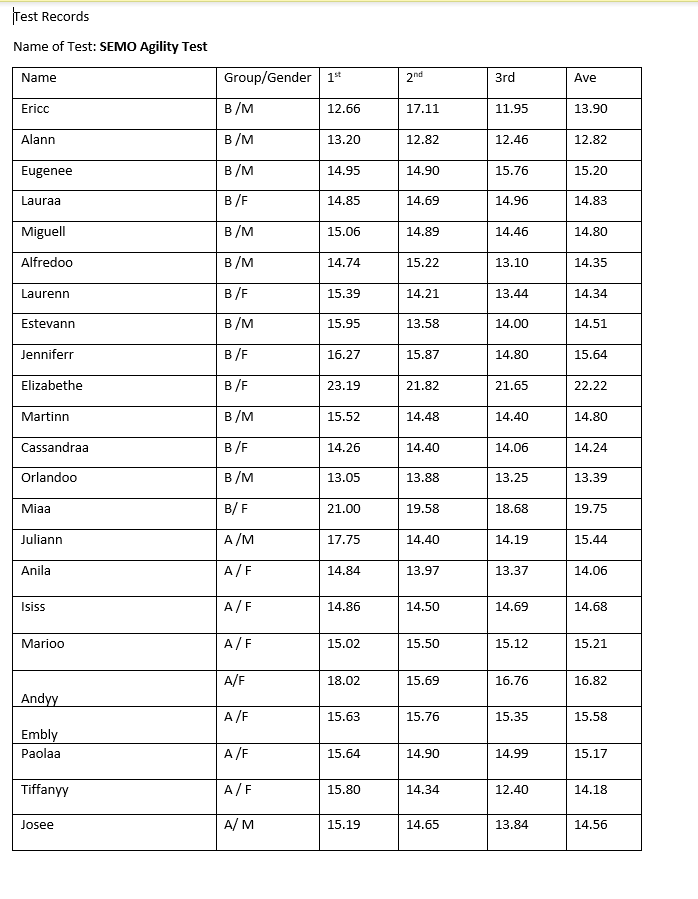
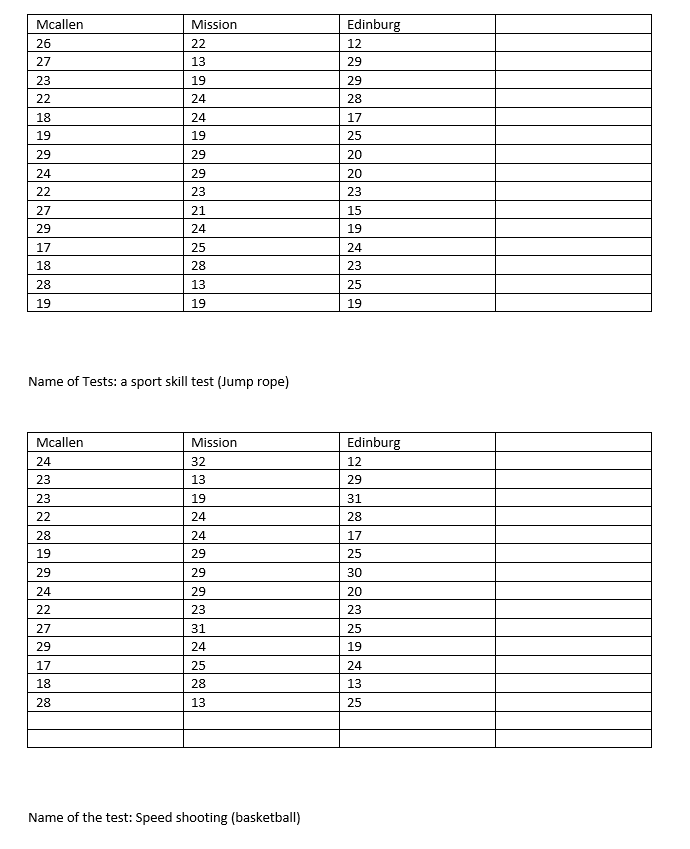
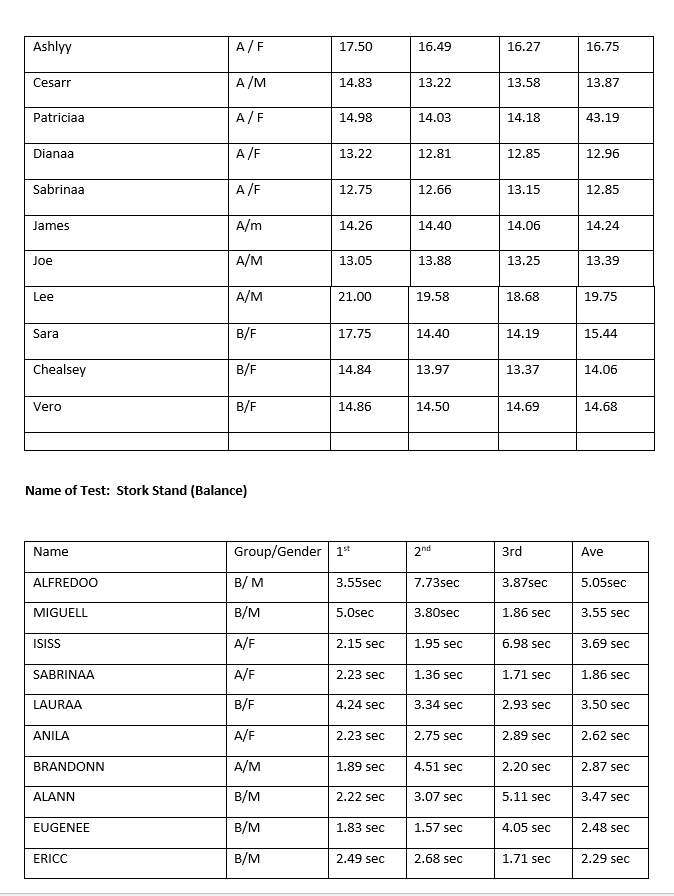
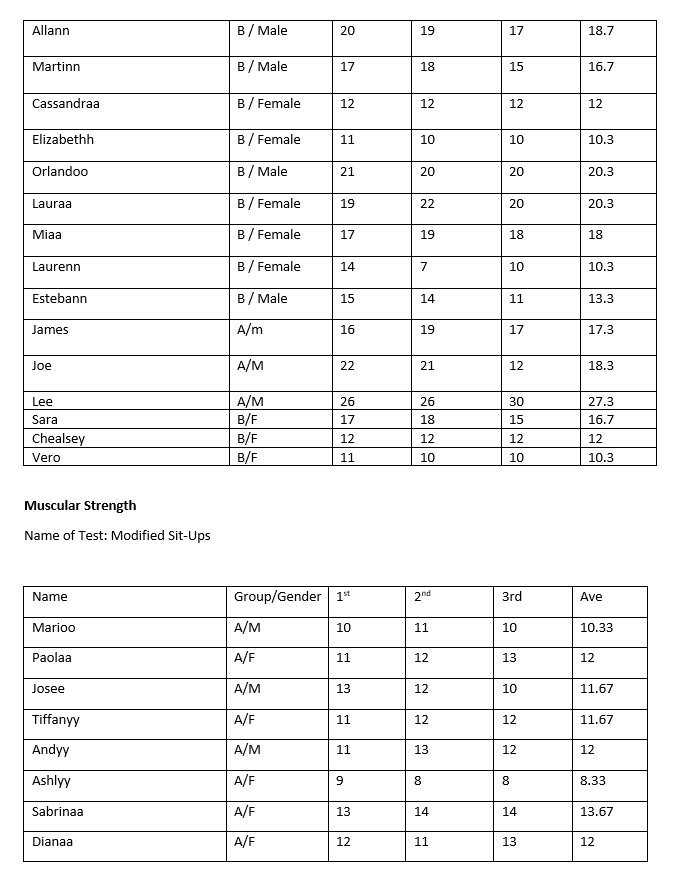
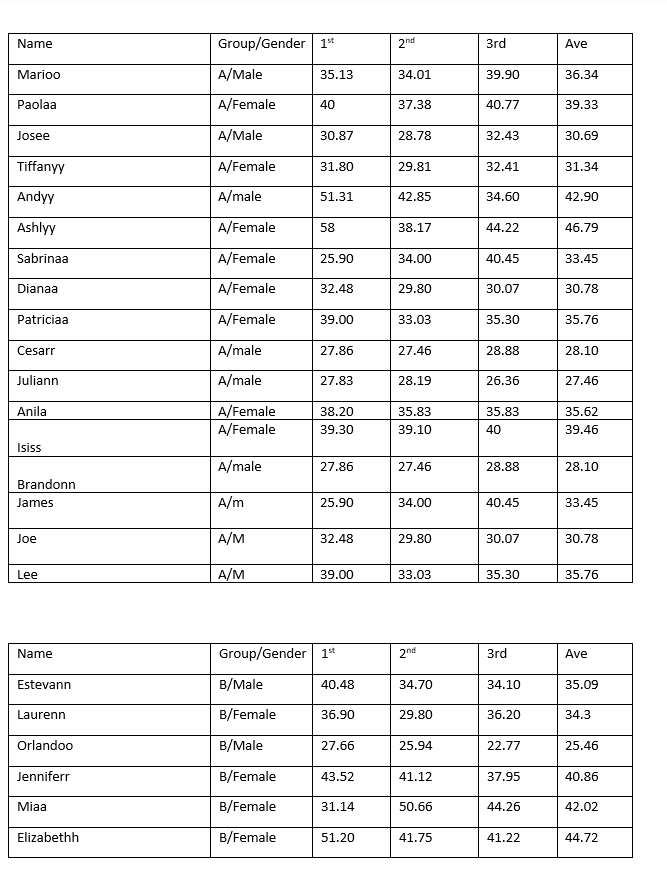
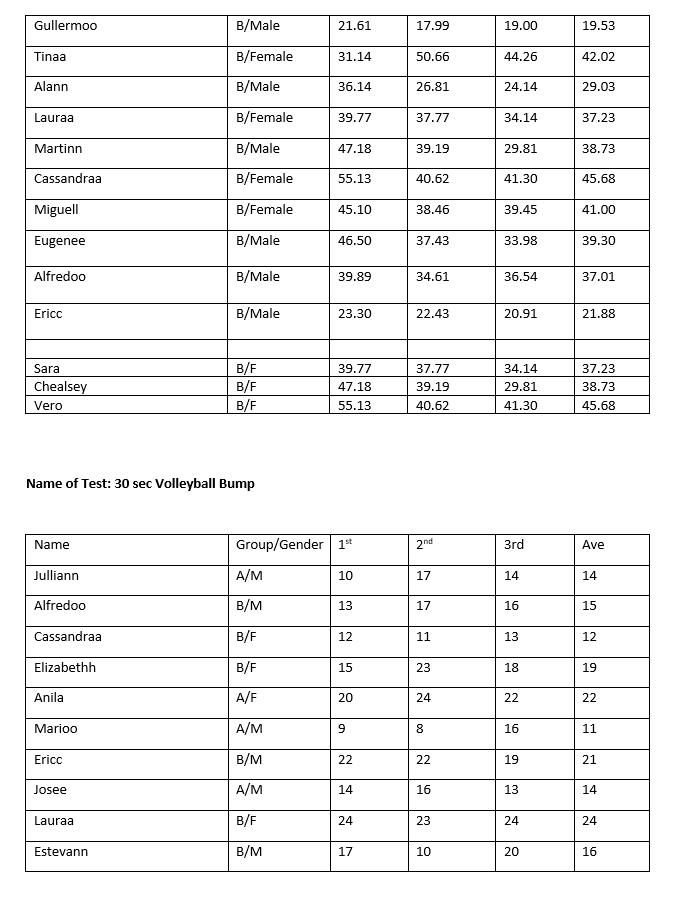
\f_ Name of Tests: 3 sport skill test [Jump rope} M _ Name of the test: Speed shooting [basketball] Group A Group B Group C 4 7 8 7 3 9 7 9 8 2 CO 8 4 9 LD LD 4 9 LO 2 5 7 4 9 4 9 7 5 8 5 9 LD 9 7 9 8Individual Projelct I. Standard scores SI. Correlation [all the data tables: 13 students only 3; using avg as 3:] WW )i[observed scores of test: all 3 trials] Percentile rank scores 1. Please calculate the standard deviation, mean, the percentile rank, 2 score, T score of 2 groups [A13 3: 0:13] from any 1 test and display all the scores on the tables [you need 2 different tables [A a B] 2. Develop the data table [Using average} and Calculate r [Pearson ProductMoment Correlation Coefficient} for any 2 test you are interested in EL interpretations. [2tables 8L 2[rIIs]. m Vollevhall Ex} Basketball W] _ 3. Draw the scattergrams of correlations between skill test scores you choose {using average scores] and interpret it. You need 2 scattergrams based on #2. ll. Independent T [Pick any 2 groups from any test: using average] 1. Develop the data table, write your research question with W EL [W and hypotheses including symbols. 2. TestStatistic [the t-ratio]. Determine the degrees of freedom. 3. Refer to the t-values in appendix 0 with df at the .05 significant level and at the .01 significant level in order to make the nal conclusion. Ill. Dependent T [T-test for paired] Pick a group [A or B] Shooting without noise Shooting with noise D [Difference] 1. Develop the data table, write your research question with W EL DH, and hypotheses including symbols. 2. TestStatistic [the t-ratio]. Determine the degrees of freedom. 3. Refer to the t-values in appendix 0 with df at the .05 significant level and at the .01 significant level in order to make the nal conclusion. \"I. ANDVA [Repeated Measure] test [use one of data sets from a group: A or B] 1.Develop the data table, write your research question with W EL DH, and hypotheses including symbols. 2. TestStatistic: Calculate the F-ratio 3. Refer to the Fdistn'bution in appendix C. Use the degrees offreedoms [.05 EL .01]. And state your research final conclusion. V. AHDVA for Independent Group [use one of data sets from two tests] 1. Develop the data table, write your research question with W 31 DH, and hypotheses including symbols 2. TestStatistic: Calculate the F-ratio 3. Refer to the Fdistn'bution in appendix C. Use the degrees offreedoms [.05 51.01] And state your research final conclusion
Step by Step Solution
There are 3 Steps involved in it

Get step-by-step solutions from verified subject matter experts