

Question: Stats Prob Topic : The Normal Distribution Data : Data Set 3 Student Daily Screen Time (in hours) 1 9 hours 2 6 hours 14
Stats Prob
Topic : The Normal Distribution
Data :
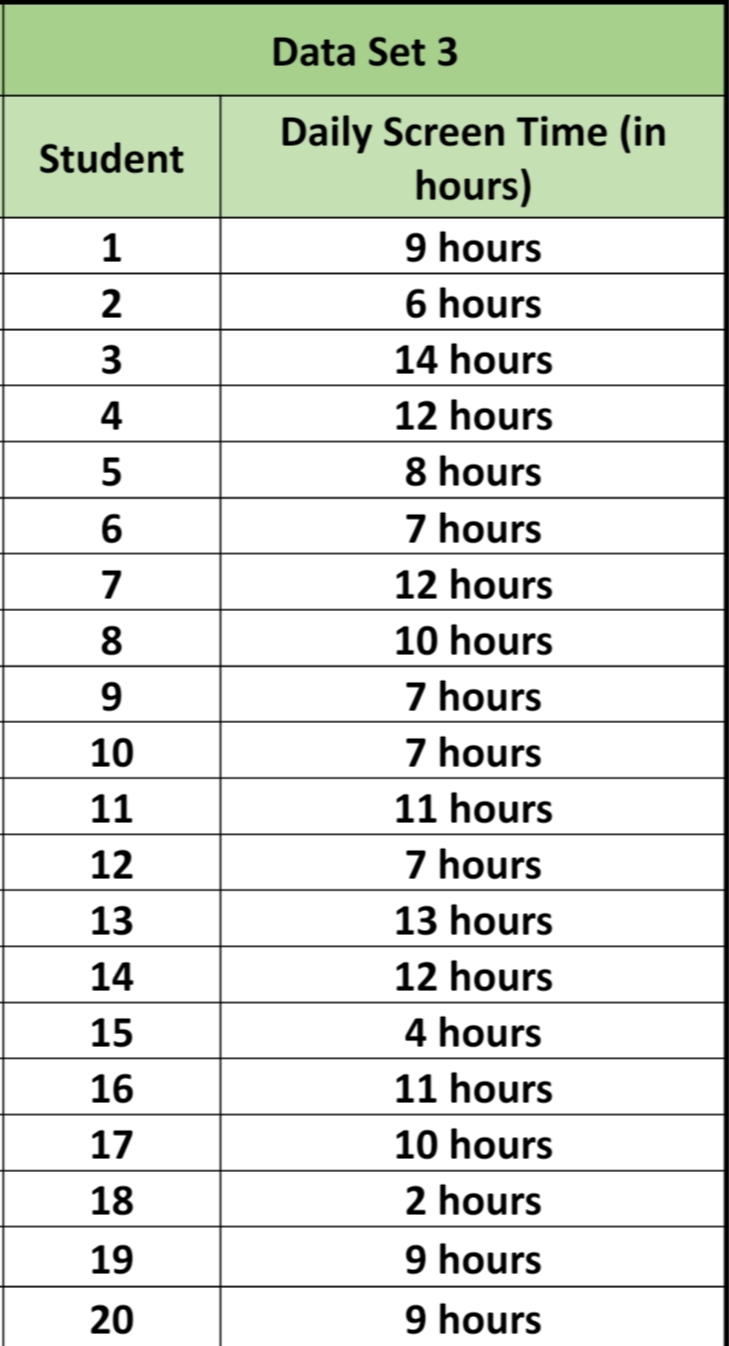
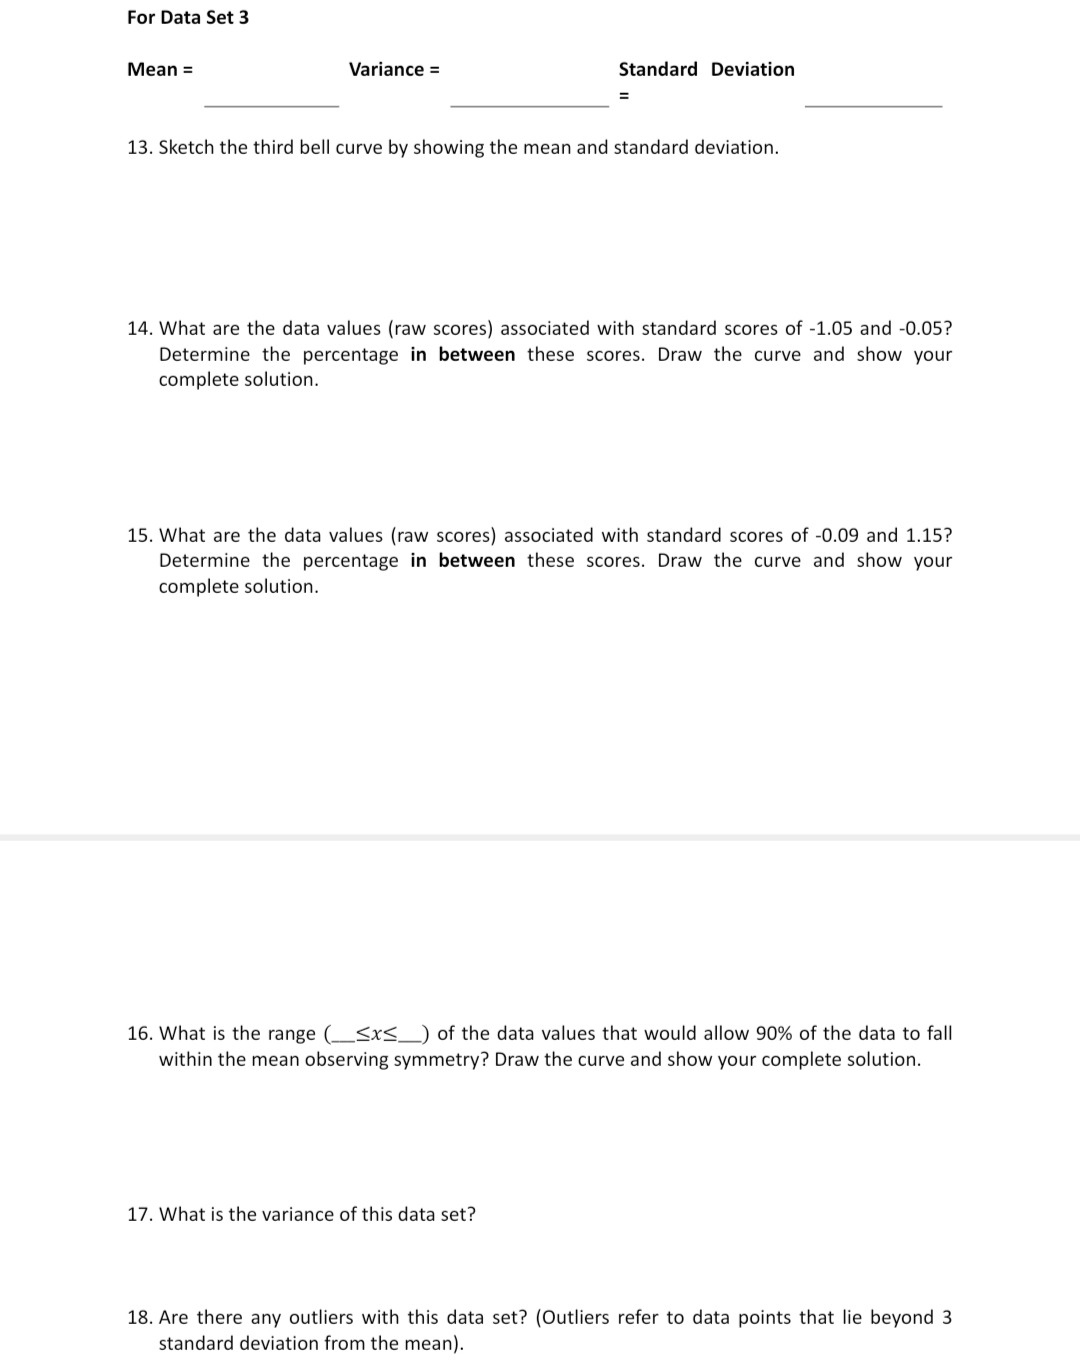
Data Set 3 Student Daily Screen Time (in hours) 1 9 hours 2 6 hours 14 hours 12 hours 8 hours 7 hours 12 hours 8 10 hours 9 7 hours 10 7 hours 11 11 hours 12 7 hours 13 13 hours 14 12 hours 15 4 hours 16 11 hours 17 10 hours 18 2 hours 19 9 hours 20 9 hoursFor Data Set 3 Mean = Variance = Standard Deviation 13. Sketch the third bell curve by showing the mean and standard deviation. 14. What are the data values (raw scores) associated with standard scores of -1.05 and 0.05? Determine the percentage in between these scores. Draw the curve and show your complete solution. 15. What are the data values (raw scores) associated with standard scores of -0.09 and 1.15? Determine the percentage in between these scores. Draw the curve and show your complete solution. 16. What is the range (_st_) of the data values that would allow 90% of the data to fall within the mean observing symmetry? Draw the curve and show your complete solution. 17. What is the variance of this data set? 18. Are there any outliers with this data set? [Outliers refer to data points that lie beyond 3 standard deviation from the mean)
Step by Step Solution
There are 3 Steps involved in it

Get step-by-step solutions from verified subject matter experts