

Question: STEP: 1 01 2 The following table shows some data for an economy that produces only two goods: milk and honey. Milk Honey Price Quantity
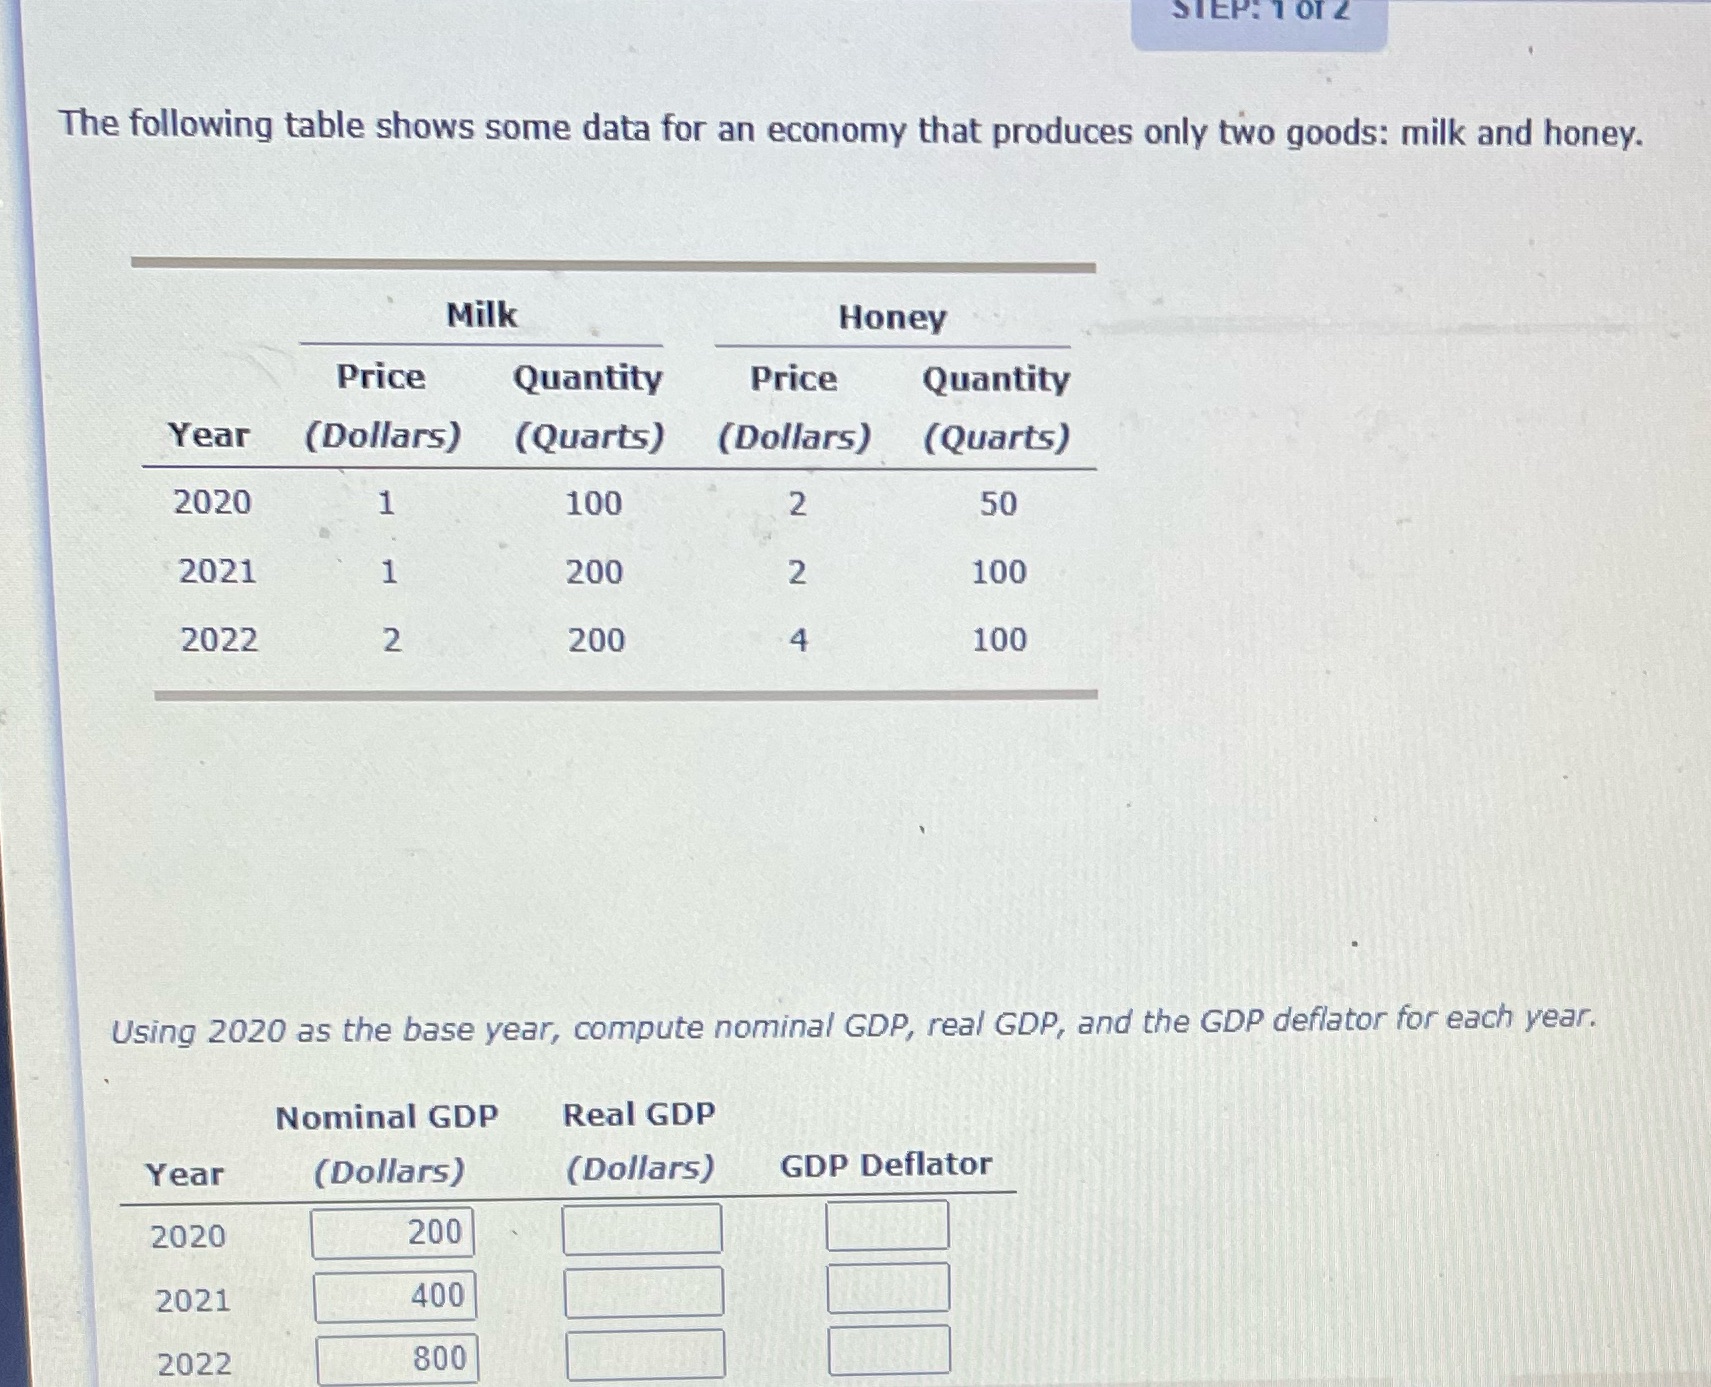
STEP: 1 01 2 The following table shows some data for an economy that produces only two goods: milk and honey. Milk Honey Price Quantity Price Quantity Year (Dollars) (Quarts) (Dollars) (Quarts) 2020 100 2 50 2021 200 N 100 2022 2 200 100 Using 2020 as the base year, compute nominal GDP, real GDP, and the GDP deflator for each year. Nominal GDP Real GDP Year (Dollars) (Dollars) GDP Deflator 2020 200 2021 400 2022 800
Step by Step Solution
There are 3 Steps involved in it
1 Expert Approved Answer
Step: 1 Unlock

Question Has Been Solved by an Expert!
Get step-by-step solutions from verified subject matter experts
Step: 2 Unlock
Step: 3 Unlock