

Question: Step 1: Data Collection Please locate and record the following pieces of information. Nike, Inc.'s Ticker Symbol: Nike, Inc.'s Fiscal Year 2020 Total Revenue: (please
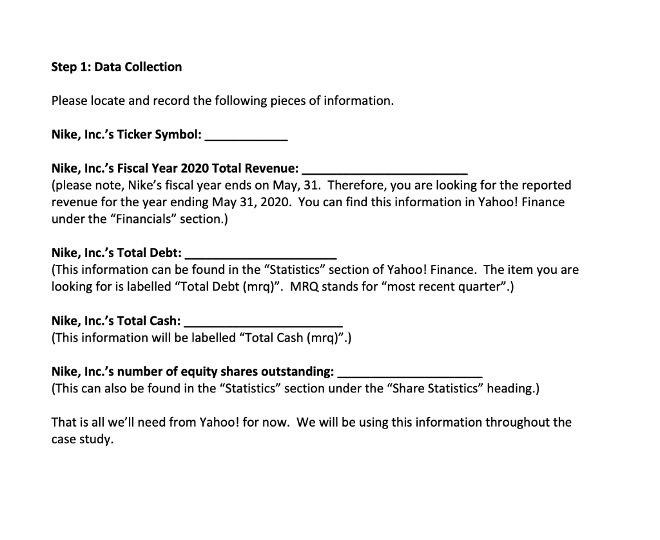
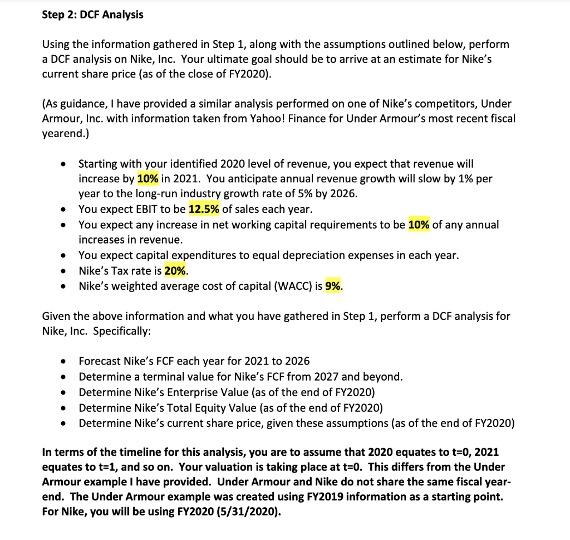
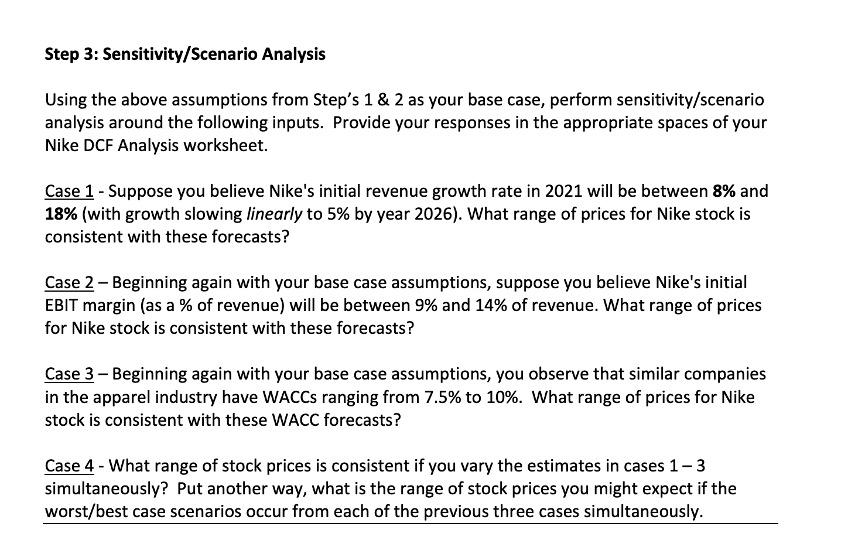
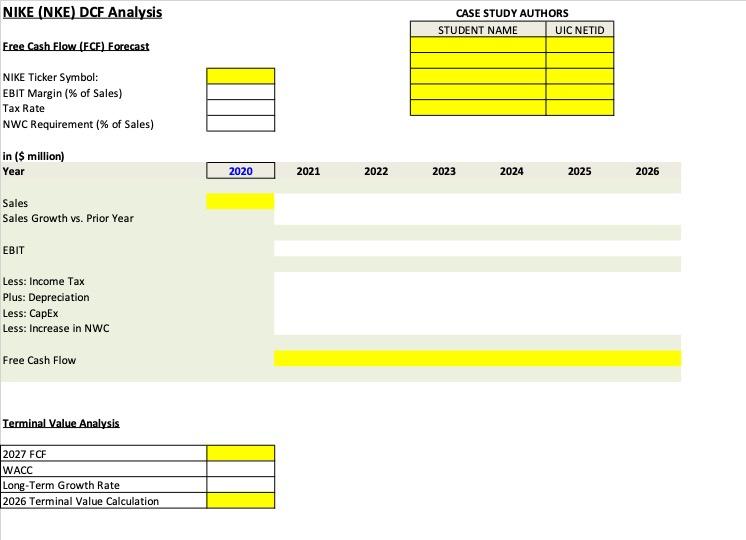
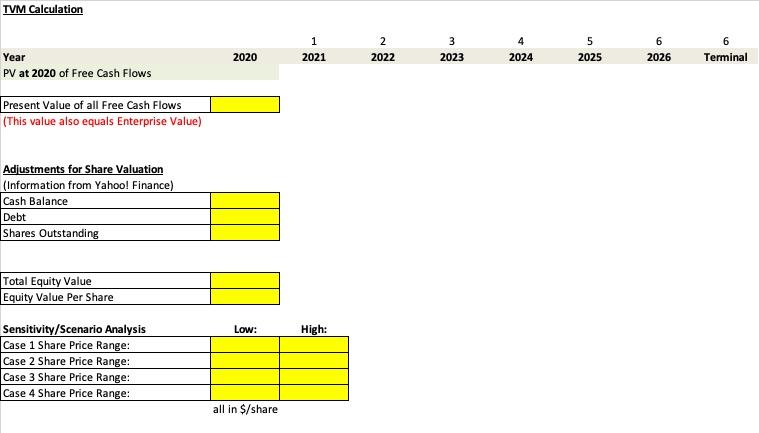
Step 1: Data Collection Please locate and record the following pieces of information. Nike, Inc.'s Ticker Symbol: Nike, Inc.'s Fiscal Year 2020 Total Revenue: (please note, Nike's fiscal year ends on May, 31. Therefore, you are looking for the reported revenue for the year ending May 31, 2020. You can find this information in Yahoo! Finance under the "Financials" section.) Nike, Inc.'s Total Debt: (This information can be found in the "Statistics" section of Yahoo! Finance. The item you are looking for is labelled "Total Debt (mra)". MRQ stands for "most recent quarter".) Nike, Inc.'s Total Cash: (This information will be labelled "Total Cash (mra)".) Nike, Inc.'s number of equity shares outstanding: (This can also be found in the "Statistics" section under the "Share Statistics" heading.) That is all we'll need from Yahoo! for now. We will be using this information throughout the case study. Step 2: DCF Analysis Using the information gathered in Step 1, along with the assumptions outlined below, perform a DCF analysis on Nike, Inc. Your ultimate goal should be to arrive at an estimate for Nike's current share price (as of the close of FY2020). (As guidance, I have provided a similar analysis performed on one of Nike's competitors, Under Armour, Inc. with information taken from Yahoo! Finance for Under Armour's most recent fiscal yearend.) Starting with your identified 2020 level of revenue, you expect that revenue will increase by 10% in 2021. You anticipate annual revenue growth will slow by 1% per year to the long-run industry growth rate of 5% by 2026. You expect EBIT to be 12.5% of sales each year. You expect any increase in net working capital requirements to be 10% of any annual increases in revenue. You expect capital expenditures to equal depreciation expenses in each year. Nike's Tax rate is 20%. Nike's weighted average cost of capital (WACC) is 9%. Given the above information and what you have gathered in Step 1, perform a DCF analysis for Nike, Inc. Specifically: Forecast Nike's FCF each year for 2021 to 2026 Determine a terminal value for Nike's FCF from 2027 and beyond. Determine Nike's Enterprise Value (as of the end of FY2020) Determine Nike's Total Equity Value (as of the end of FY2020) Determine Nike's current share price, given these assumptions (as of the end of FY2020) In terms of the timeline for this analysis, you are to assume that 2020 equates to t=0, 2021 equates to t=1, and so on. Your valuation is taking place at t=0. This differs from the Under Armour example I have provided. Under Armour and Nike do not share the same fiscal year- end. The Under Armour example was created using FY2019 information as a starting point. For Nike, you will be using FY2020 (5/31/2020). Step 3: Sensitivity/Scenario Analysis Using the above assumptions from Step's 1 & 2 as your base case, perform sensitivity/scenario analysis around the following inputs. Provide your responses in the appropriate spaces of your Nike DCF Analysis worksheet. Case 1 - Suppose you believe Nike's initial revenue growth rate in 2021 will be between 8% and 18% (with growth slowing linearly to 5% by year 2026). What range of prices for Nike stock is consistent with these forecasts? Case 2 - Beginning again with your base case assumptions, suppose you believe Nike's initial EBIT margin (as a % of revenue) will be between 9% and 14% of revenue. What range of prices for Nike stock is consistent with these forecasts? Case 3 - Beginning again with your base case assumptions, you observe that similar companies in the apparel industry have WACCs ranging from 7.5% to 10%. What range of prices for Nike stock is consistent with these WACC forecasts? Case 4 - What range of stock prices is consistent if you vary the estimates in cases 1-3 simultaneously? Put another way, what is the range of stock prices you might expect if the worst/best case scenarios occur from each of the previous three cases simultaneously. NIKE (NKE) DCF Analysis CASE STUDY AUTHORS STUDENT NAME UIC NETID Free Cash Flow (FCF) Forecast NIKE Ticker Symbol: EBIT Margin(% of Sales) Tax Rate NWC Requirement (% of Sales) in ($ million) Year 2020 2021 2022 2023 2024 2025 2026 Sales Sales Growth vs. Prior Year EBIT Less: Income Tax Plus: Depreciation Less: CapEx Less: Increase in NWC Free Cash Flow Terminal Value Analysis 2027 FCF WACC Long-Term Growth Rate 2026 Terminal Value Calculation TVM Calculation 1 2 3 4 5 6 6 Year 2020 2021 2022 2023 2024 2025 2026 Terminal PV at 2020 of Free Cash Flows Present Value of all Free Cash Flows (This value also equals Enterprise Value) Adjustments for Share Valuation (Information from Yahoo! Finance) Cash Balance Debt Shares Outstanding Total Equity Value Equity Value Per Share Low: High: Sensitivity/Scenario Analysis Case 1 Share Price Range: Case 2 Share Price Range: Case 3 Share Price Range: Case 4 Share Price Range: all in $/share Step 1: Data Collection Please locate and record the following pieces of information. Nike, Inc.'s Ticker Symbol: Nike, Inc.'s Fiscal Year 2020 Total Revenue: (please note, Nike's fiscal year ends on May, 31. Therefore, you are looking for the reported revenue for the year ending May 31, 2020. You can find this information in Yahoo! Finance under the "Financials" section.) Nike, Inc.'s Total Debt: (This information can be found in the "Statistics" section of Yahoo! Finance. The item you are looking for is labelled "Total Debt (mra)". MRQ stands for "most recent quarter".) Nike, Inc.'s Total Cash: (This information will be labelled "Total Cash (mra)".) Nike, Inc.'s number of equity shares outstanding: (This can also be found in the "Statistics" section under the "Share Statistics" heading.) That is all we'll need from Yahoo! for now. We will be using this information throughout the case study. Step 2: DCF Analysis Using the information gathered in Step 1, along with the assumptions outlined below, perform a DCF analysis on Nike, Inc. Your ultimate goal should be to arrive at an estimate for Nike's current share price (as of the close of FY2020). (As guidance, I have provided a similar analysis performed on one of Nike's competitors, Under Armour, Inc. with information taken from Yahoo! Finance for Under Armour's most recent fiscal yearend.) Starting with your identified 2020 level of revenue, you expect that revenue will increase by 10% in 2021. You anticipate annual revenue growth will slow by 1% per year to the long-run industry growth rate of 5% by 2026. You expect EBIT to be 12.5% of sales each year. You expect any increase in net working capital requirements to be 10% of any annual increases in revenue. You expect capital expenditures to equal depreciation expenses in each year. Nike's Tax rate is 20%. Nike's weighted average cost of capital (WACC) is 9%. Given the above information and what you have gathered in Step 1, perform a DCF analysis for Nike, Inc. Specifically: Forecast Nike's FCF each year for 2021 to 2026 Determine a terminal value for Nike's FCF from 2027 and beyond. Determine Nike's Enterprise Value (as of the end of FY2020) Determine Nike's Total Equity Value (as of the end of FY2020) Determine Nike's current share price, given these assumptions (as of the end of FY2020) In terms of the timeline for this analysis, you are to assume that 2020 equates to t=0, 2021 equates to t=1, and so on. Your valuation is taking place at t=0. This differs from the Under Armour example I have provided. Under Armour and Nike do not share the same fiscal year- end. The Under Armour example was created using FY2019 information as a starting point. For Nike, you will be using FY2020 (5/31/2020). Step 3: Sensitivity/Scenario Analysis Using the above assumptions from Step's 1 & 2 as your base case, perform sensitivity/scenario analysis around the following inputs. Provide your responses in the appropriate spaces of your Nike DCF Analysis worksheet. Case 1 - Suppose you believe Nike's initial revenue growth rate in 2021 will be between 8% and 18% (with growth slowing linearly to 5% by year 2026). What range of prices for Nike stock is consistent with these forecasts? Case 2 - Beginning again with your base case assumptions, suppose you believe Nike's initial EBIT margin (as a % of revenue) will be between 9% and 14% of revenue. What range of prices for Nike stock is consistent with these forecasts? Case 3 - Beginning again with your base case assumptions, you observe that similar companies in the apparel industry have WACCs ranging from 7.5% to 10%. What range of prices for Nike stock is consistent with these WACC forecasts? Case 4 - What range of stock prices is consistent if you vary the estimates in cases 1-3 simultaneously? Put another way, what is the range of stock prices you might expect if the worst/best case scenarios occur from each of the previous three cases simultaneously. NIKE (NKE) DCF Analysis CASE STUDY AUTHORS STUDENT NAME UIC NETID Free Cash Flow (FCF) Forecast NIKE Ticker Symbol: EBIT Margin(% of Sales) Tax Rate NWC Requirement (% of Sales) in ($ million) Year 2020 2021 2022 2023 2024 2025 2026 Sales Sales Growth vs. Prior Year EBIT Less: Income Tax Plus: Depreciation Less: CapEx Less: Increase in NWC Free Cash Flow Terminal Value Analysis 2027 FCF WACC Long-Term Growth Rate 2026 Terminal Value Calculation TVM Calculation 1 2 3 4 5 6 6 Year 2020 2021 2022 2023 2024 2025 2026 Terminal PV at 2020 of Free Cash Flows Present Value of all Free Cash Flows (This value also equals Enterprise Value) Adjustments for Share Valuation (Information from Yahoo! Finance) Cash Balance Debt Shares Outstanding Total Equity Value Equity Value Per Share Low: High: Sensitivity/Scenario Analysis Case 1 Share Price Range: Case 2 Share Price Range: Case 3 Share Price Range: Case 4 Share Price Range: all in $/share
Step by Step Solution
There are 3 Steps involved in it

Get step-by-step solutions from verified subject matter experts