

Question: Step 1: Interpret the Levene's test. Step 2: Report the means and standard deviations for each group .(USE THE GROUP STATISTICS TABLE) State the results
Step 1:
- Interpret the Levene's test.
Step 2:
- Report the means and standard deviationsfor each group.(USE THE GROUP STATISTICS TABLE)
- State the results of the t-testusing the "Assume equal variances" row.
- Interpret the statistical results against the null hypothesis and state whether it is accepted or rejected.
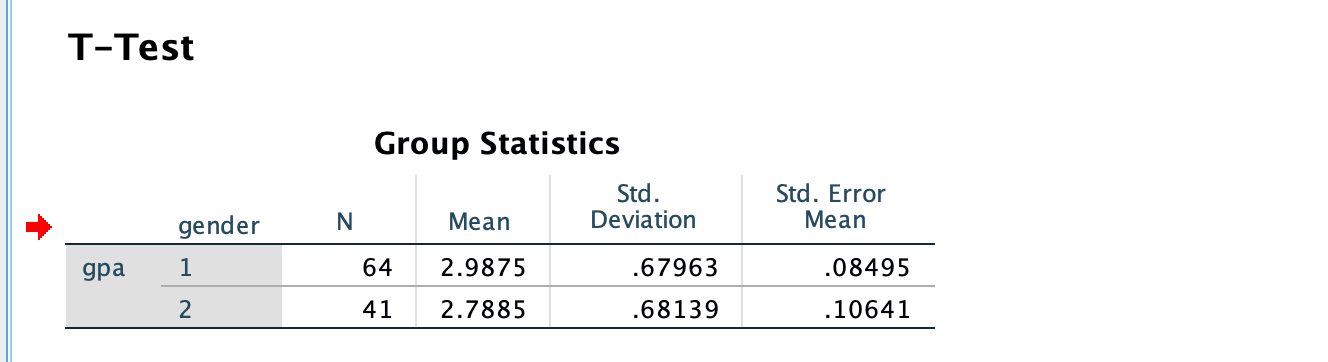
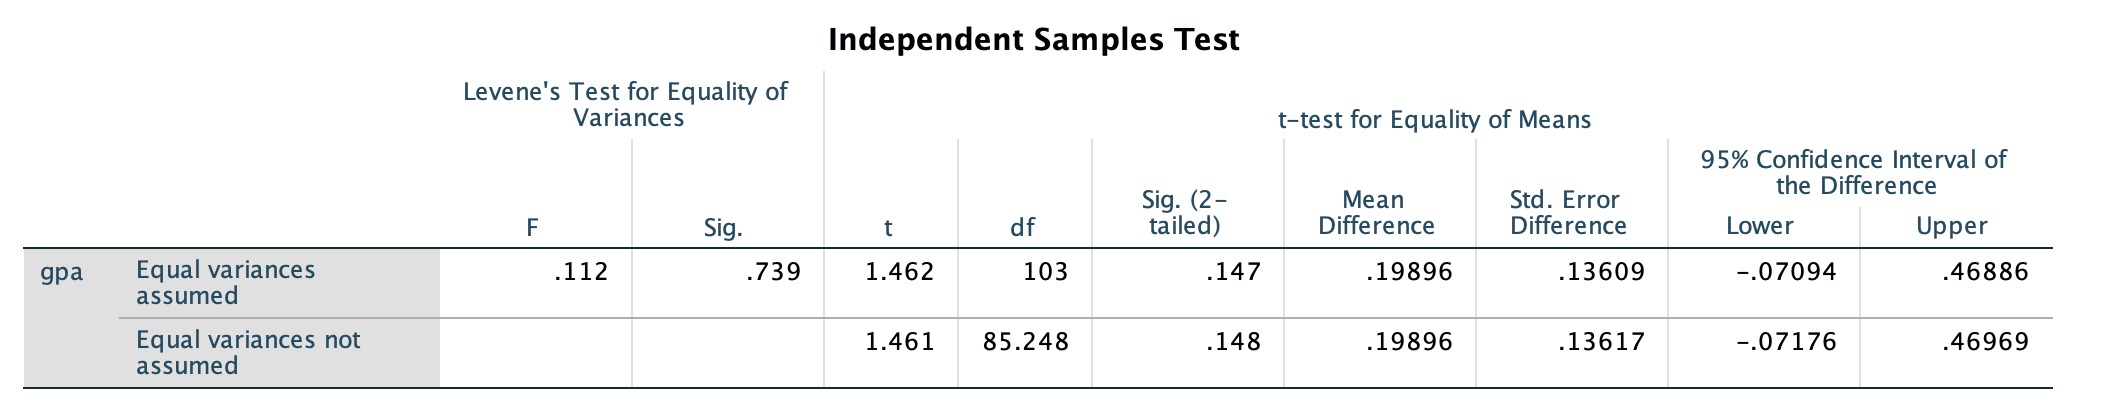
T-Test Group Statistics Std. Std. Error gender N Mean Deviation Mean gpa 1 64 2.9875 67963 08495 2 41 2.7885 .68139 . 10641Independent Samples Test Levene's Test for Equality of Variances t-test for Equality of Means 95% Confidence Interval of Sig. (2- Mean Std. Error the Difference F Sig. t df tailed) Difference Difference Lower Upper gpa Equal variances .112 739 1.462 103 147 19896 13609 assumed -.07094 46886 Equal variances not 1.461 85.248 .148 19896 13617 assumed -.07176 .46969
Step by Step Solution
There are 3 Steps involved in it
1 Expert Approved Answer
Step: 1 Unlock

Question Has Been Solved by an Expert!
Get step-by-step solutions from verified subject matter experts
Step: 2 Unlock
Step: 3 Unlock