

Question: Step 1: perform a ratio analysis that includes ROA; ROE; Debt/Assets and any other financial ratio you deem important. Step 2: perform another ratio analysis
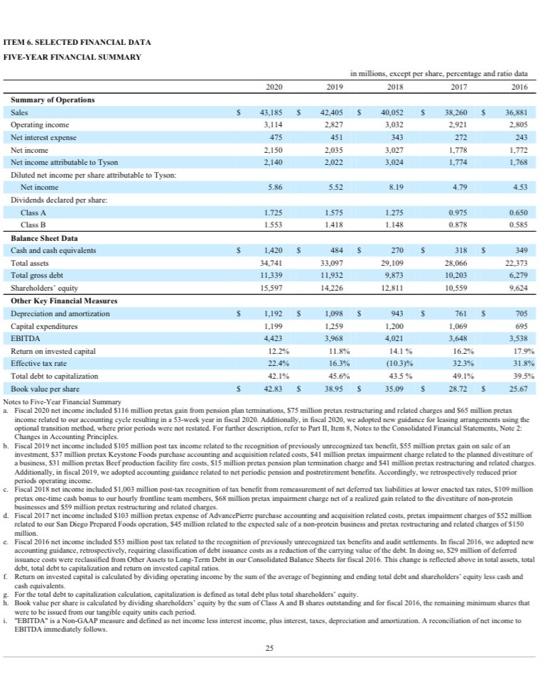
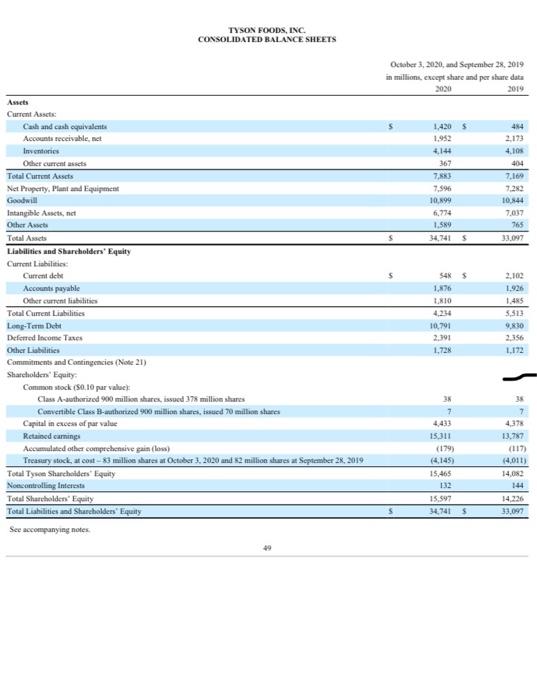
Step 1: perform a ratio analysis that includes ROA; ROE; Debt/Assets and any other financial ratio you deem important. Step 2: perform another ratio analysis with the same ratios except you need to adjust for Goodwill as set forth in the Home Depot Financial Story presentation. Step 3: you need to discuss the revised ratio computations in Step 2 compared to Step 1. Please be sure to include any insights and related thoughts rather than just noting the differences in your computations. We are always taught the importance of the financial ratio analysis and the related insights derived; however, the "revised" ratio analysis you perform in Step 2 may yield additional insights into the organization. As a strategist, it is important to go beyond the standard analysis and as a business professional your thoughts and insights are important. This homework assignment will be due as a file upload in Canvas by midnight Wednesday 16 June 2021. Please let me know if you have any questions. ITEM & SELECTED FINANCIAL DATA FIVE-YEAR FINANCIAL SUMMARY in millions, except per share, percentage and rate data 2020 2019 2018 2017 2016 Summary of Operations Sales 43,1855 42.405 $ $ 38.260 $ 36.81 40,052 3,032 Operating income 2.827 2.921 2. Net interest expense 475 451 43 272 243 Net income 2.150 2.035 3,027 1.776 1.772 2.140 2.022 3,024 1.774 1.764 Net income attributable to Tyson Diluted net income per share tributable to Tyson: Net income 5.86 552 8.19 4.79 4.53 Dividends declared per share Class A Class 1575 1.275 0975 0.650 1725 1553 27 0585 Balance Sheet Data 1.420 $ 484 $ 270 $ 318 5 149 34.741 33,097 29,109 28.066 22173 11.339 11,932 9,873 10.200 6.279 Cash and cash equivalents Total Total gross det Shareholders' equity Other Key Financial Measures Depreciation and amorturation Capital expenditures EBITDA 15.597 14.226 12.811 10.559 1,192 1.0955 943 3 7615 705 1,199 1.259 1,200 1,069 695 4.423 4,021 3.64 3,398 12.24 3,963 11 16:39 1415 16.26 Return on invested capital Effective tax rate 17.99 22.4% (10.3% 3234 31.84 45.6% 435% 49.1%. 39.5% 42.81 $ 18.955 35.09 28.725 25.67 Total debt to capitalization Book value per share Notes to Five Year Financial Summary Fiscal 2020 met income included 5116 million pectus quis from pension plan termination 575 million prete restructuring and related charges and 565 million pectus income related to our accounting syllting in a 53- weck year in fiscal 2020 Additionally, in fiscal 2000, we adapted dance for leasing arrangements in the optional transition method where prior periods were not restarted. For further description, refer to Part It, Item Notes to the Consolidated Financial Statements, Note 2 Clunges in Accounting Principles Fiscal 2019 dincome included $105 million post tax income related to the recognition of prey cognised to headfit, 55 million pret paine sale of an investment 537 million pretas Keystone Foods purchase accounting and acquisition related costs 541 million pector impairment change related to the planned divestitute of a businew, 531 milice preta Hefperedaction facility fie coste S5 million pectuspension plan temination charge and 541 million pectacturing and related charges Additionally. in fiscal 2019, we adopted accounting guidance related to set periodic pension and postretirement benefits. Accordingly, we retrospectively reduced prior period operating income c. Fiscal 2018 met income included 51,063 million post-tax recognition of tax benefit from comment of net deemed tax liablities at lower enacted tax rates. 10 million peatus one-time cabost or bounty Borline team members. 568 million pectus impairment change net of arcained gain related to the investiture of non-protein & Fiscal 2017 net income included 5163 million peetan expense of Advance Plene purchase accounting and acquisition related cost, pretex impairment changes od 552 million iclated to our San Diego Prepared Foods operation 545 million related to the expected sale of protein businen and prestar restructuring and related charges of $150 million Fiscal 2016 set income included 553 millises tax rated to the cognition of previnyecognised at benefits and littlements. In fal 2016, we adopted new accounting guidance, retrospectively, requiring classification of dicht isance costs as a reduction of the carrying value of the debt is doing so, 529 million of deferred suance costs were reclassified from Other Acts to Long-Term Deht in our Consolidated Balance Sheets for fiscal 2016. This change in selected above in total det total debt to capitaluation and retam de invested capital matin Return on invested capital is calculated by dividing operating income by the sum of the average of beginning and ending total debt and scholders equity cash and cash equivalente For the total debt to capitalization calculation, capitalization is defined as total dhe plus total sharcholdenpuity. Rookvale per ate is calculated by dividing holders' quity by the sum of Class A and Bestanding and for fiscal 2016, the remaining minimum shares that were to be issued from our tangible equity is cach period EBITDA" Neo GAAP meat and defined as net incomme les interest income, plus interese, tate, deprecated amotination. Asoceciliation of ter come to follows 25 TYSON FOODS, INC. CONSOLIDATED BALANCE SHEETS October 3, 2020, and September 28, 2019 in millions encept share and per share data 2020 2019 Assets Current Assets 1,420 414 Cash and cash equivalente Accounts receivable, 1.952 2.173 Inventories 4,144 4.10 367 404 Other current Total Current Assets 7.833 7.16 7.596 Net Property, Plunt and Equipment Goodwill 10.199 10,844 6,774 7037 Intangible Asset, net Other Acts 1.589 765 Total Assets 34,741 33.097 Liabilities and Shareholders' Equity Current Liabilities Current del 54 5 2.100 1,876 1.926 LIO 1.45 Accounts payable Other current liabilities Total Current Liabilities Long-Term Debt Deferred Income Taxes 4234 3.513 10791 9830 2.391 2,356 Other Liabilities 1.728 1.172 Commitments and Contingencies (Note 21) Sharcholden' Equity Common stock (50.10 par value Class Authorized 900 million shares, issued 378 million shares Convertible Class B-authorized 900 million shares, ssued 70 million sur 7 4,433 4373 15.311 13,787 (179) (117) 14.011) Capital in excess of par value Retained caring Accumulated other comprehensive gain (los) Treasury stock, ut cost-83 million shares at October 3. 2020 and 2 million shares at September 28, 2019 Total Tyre Shareholders' Equity No controlling Interest Total Shareholders' Equity Total Liabilities and Shareholders' Equity 14.02 15.465 132 144 15.597 14.226 34.741 $ 33.097 See accompanying notes Step 1: perform a ratio analysis that includes ROA; ROE; Debt/Assets and any other financial ratio you deem important. Step 2: perform another ratio analysis with the same ratios except you need to adjust for Goodwill as set forth in the Home Depot Financial Story presentation. Step 3: you need to discuss the revised ratio computations in Step 2 compared to Step 1. Please be sure to include any insights and related thoughts rather than just noting the differences in your computations. We are always taught the importance of the financial ratio analysis and the related insights derived; however, the "revised" ratio analysis you perform in Step 2 may yield additional insights into the organization. As a strategist, it is important to go beyond the standard analysis and as a business professional your thoughts and insights are important. This homework assignment will be due as a file upload in Canvas by midnight Wednesday 16 June 2021. Please let me know if you have any questions. ITEM & SELECTED FINANCIAL DATA FIVE-YEAR FINANCIAL SUMMARY in millions, except per share, percentage and rate data 2020 2019 2018 2017 2016 Summary of Operations Sales 43,1855 42.405 $ $ 38.260 $ 36.81 40,052 3,032 Operating income 2.827 2.921 2. Net interest expense 475 451 43 272 243 Net income 2.150 2.035 3,027 1.776 1.772 2.140 2.022 3,024 1.774 1.764 Net income attributable to Tyson Diluted net income per share tributable to Tyson: Net income 5.86 552 8.19 4.79 4.53 Dividends declared per share Class A Class 1575 1.275 0975 0.650 1725 1553 27 0585 Balance Sheet Data 1.420 $ 484 $ 270 $ 318 5 149 34.741 33,097 29,109 28.066 22173 11.339 11,932 9,873 10.200 6.279 Cash and cash equivalents Total Total gross det Shareholders' equity Other Key Financial Measures Depreciation and amorturation Capital expenditures EBITDA 15.597 14.226 12.811 10.559 1,192 1.0955 943 3 7615 705 1,199 1.259 1,200 1,069 695 4.423 4,021 3.64 3,398 12.24 3,963 11 16:39 1415 16.26 Return on invested capital Effective tax rate 17.99 22.4% (10.3% 3234 31.84 45.6% 435% 49.1%. 39.5% 42.81 $ 18.955 35.09 28.725 25.67 Total debt to capitalization Book value per share Notes to Five Year Financial Summary Fiscal 2020 met income included 5116 million pectus quis from pension plan termination 575 million prete restructuring and related charges and 565 million pectus income related to our accounting syllting in a 53- weck year in fiscal 2020 Additionally, in fiscal 2000, we adapted dance for leasing arrangements in the optional transition method where prior periods were not restarted. For further description, refer to Part It, Item Notes to the Consolidated Financial Statements, Note 2 Clunges in Accounting Principles Fiscal 2019 dincome included $105 million post tax income related to the recognition of prey cognised to headfit, 55 million pret paine sale of an investment 537 million pretas Keystone Foods purchase accounting and acquisition related costs 541 million pector impairment change related to the planned divestitute of a businew, 531 milice preta Hefperedaction facility fie coste S5 million pectuspension plan temination charge and 541 million pectacturing and related charges Additionally. in fiscal 2019, we adopted accounting guidance related to set periodic pension and postretirement benefits. Accordingly, we retrospectively reduced prior period operating income c. Fiscal 2018 met income included 51,063 million post-tax recognition of tax benefit from comment of net deemed tax liablities at lower enacted tax rates. 10 million peatus one-time cabost or bounty Borline team members. 568 million pectus impairment change net of arcained gain related to the investiture of non-protein & Fiscal 2017 net income included 5163 million peetan expense of Advance Plene purchase accounting and acquisition related cost, pretex impairment changes od 552 million iclated to our San Diego Prepared Foods operation 545 million related to the expected sale of protein businen and prestar restructuring and related charges of $150 million Fiscal 2016 set income included 553 millises tax rated to the cognition of previnyecognised at benefits and littlements. In fal 2016, we adopted new accounting guidance, retrospectively, requiring classification of dicht isance costs as a reduction of the carrying value of the debt is doing so, 529 million of deferred suance costs were reclassified from Other Acts to Long-Term Deht in our Consolidated Balance Sheets for fiscal 2016. This change in selected above in total det total debt to capitaluation and retam de invested capital matin Return on invested capital is calculated by dividing operating income by the sum of the average of beginning and ending total debt and scholders equity cash and cash equivalente For the total debt to capitalization calculation, capitalization is defined as total dhe plus total sharcholdenpuity. Rookvale per ate is calculated by dividing holders' quity by the sum of Class A and Bestanding and for fiscal 2016, the remaining minimum shares that were to be issued from our tangible equity is cach period EBITDA" Neo GAAP meat and defined as net incomme les interest income, plus interese, tate, deprecated amotination. Asoceciliation of ter come to follows 25 TYSON FOODS, INC. CONSOLIDATED BALANCE SHEETS October 3, 2020, and September 28, 2019 in millions encept share and per share data 2020 2019 Assets Current Assets 1,420 414 Cash and cash equivalente Accounts receivable, 1.952 2.173 Inventories 4,144 4.10 367 404 Other current Total Current Assets 7.833 7.16 7.596 Net Property, Plunt and Equipment Goodwill 10.199 10,844 6,774 7037 Intangible Asset, net Other Acts 1.589 765 Total Assets 34,741 33.097 Liabilities and Shareholders' Equity Current Liabilities Current del 54 5 2.100 1,876 1.926 LIO 1.45 Accounts payable Other current liabilities Total Current Liabilities Long-Term Debt Deferred Income Taxes 4234 3.513 10791 9830 2.391 2,356 Other Liabilities 1.728 1.172 Commitments and Contingencies (Note 21) Sharcholden' Equity Common stock (50.10 par value Class Authorized 900 million shares, issued 378 million shares Convertible Class B-authorized 900 million shares, ssued 70 million sur 7 4,433 4373 15.311 13,787 (179) (117) 14.011) Capital in excess of par value Retained caring Accumulated other comprehensive gain (los) Treasury stock, ut cost-83 million shares at October 3. 2020 and 2 million shares at September 28, 2019 Total Tyre Shareholders' Equity No controlling Interest Total Shareholders' Equity Total Liabilities and Shareholders' Equity 14.02 15.465 132 144 15.597 14.226 34.741 $ 33.097 See accompanying notes
Step by Step Solution
There are 3 Steps involved in it

Get step-by-step solutions from verified subject matter experts