

Question: Step #1: Review the STAT200 data set file. (Attached) Step #2: Develop descriptive statistics data analysis plan. Task 1: Develop scenario. Imagine that you are
Step #1: Review the STAT200 data set file. (Attached)
Step #2: Develop descriptive statistics data analysis plan.
Task 1: Develop scenario. Imagine that you are head of a household and have to determine a household budget plan based on the data available from the dataset. For instance, you are a 35 year old single parent with a high school diploma and one child.
Task 2: Select variables for analysis that match the scenario developed in Task 1.The data set provides information on household consumption; there are socioeconomic variables and expenditures variables. The socioeconomic variable names start with "SE-" and the expenditure variable names start with a "USD;" all expenditures are in US dollars. All students must use income as one variable. Select two additional socioeconomic variables (one qualitative and one quantitative) and two expenditures for your analysis that match the scenario you developed for Task 1. For instance, using the example scenario of a 35 year old single parent with a high
STAT200: Written Assignment #1 - Descriptive Statistics Data Analysis Plan - Instructions Page 1 of 4
school diploma and one child, you could select "income," "education," and "number of children" as socioeconomic variables and then pick two household expenditure items to show the distribution of costs and compare that with your income. When selecting variables, think about the following three questions:
o Why am I choosing these variables?
o What interests me about these variables?
o What do I think will be the outcome?
? Task 3: Determine appropriate measures of central tendency and dispersion for the selected variables. For each quantitative variable, select at least one measure of central tendency and at least one measure of dispersion (Please see below table for list of measures). For the qualitative variable, select one measure of central tendency. When determining the measures of central tendency and dispersion, think about what is appropriate given the level of measurement and type of variable. Recommend referring to the text and information posted in our LEO classroom to help with this task (Note: you will use this information to provide a rationale for your choice of measures).
Measures of Central Tendency Measures of Dispersion
? Mean ? Mode ? Median
? Range
? Sample Standard Deviation ? Variance
? Task 4: Determine appropriate graph and/or table for each of the selected variables. Select one graph or table for each variable (Please see below table for list of graphs and tables). When determining the graphs and tables, think about what is appropriate given the level of measurement and type of variable. Recommend referring to the text and information posted in our LEO classroom to help with this task (Note: you will use this information to provide a rationale for your choice of graphs and/or tables).
Types of Graphs Types of Tables
? Pie Chart
? Bar Chart
? Histogram
? Box Plots (also known as Box-and-Whiskers Plot)
? Frequency Table
? Relative Frequency Table ? Grouped
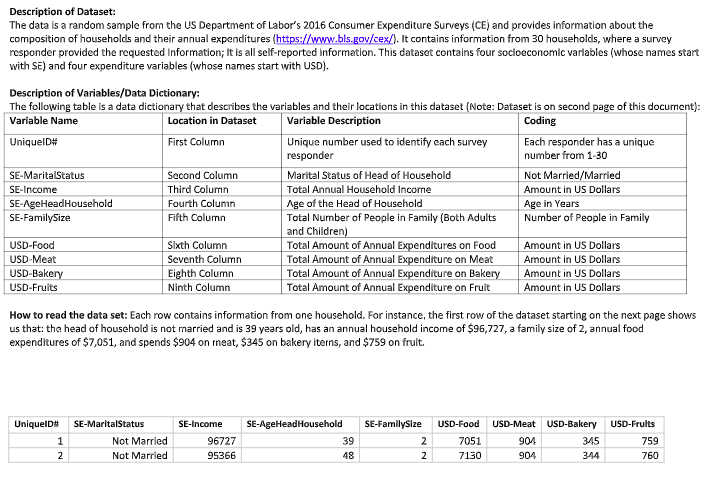
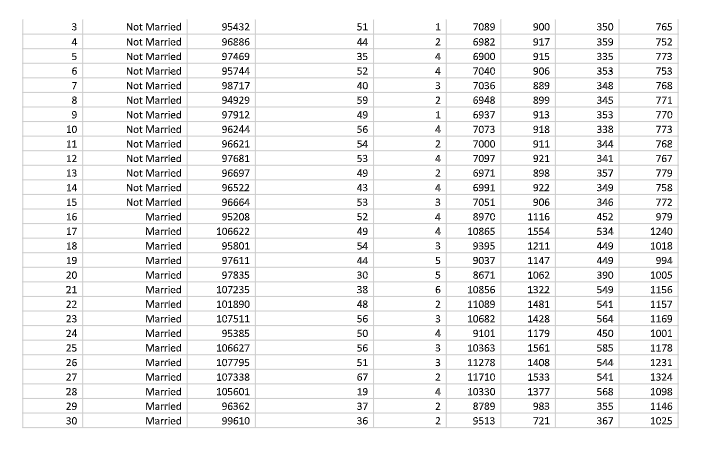
Description of Dataset: The data is a random sample from the US Department of Labor's 2016 Consumer Expenditure Surveys (CE) and provides information about the composition of households and their annual expenditures (https://www.bls.gov/cex/). It contains information from 30 households, where a survey responder provided the requested Information; It is all self-reported Information. This dataset contains four socioeconomic variables (whose names start with SE) and four expenditure variables (whose names start with USD). Description of Variables/Data Dictionary: The following table is a data dictionary that describes the variables and their locations in this dataset (Note: Dataset is on second page of this document): Variable Name Location in Dataset Variable Description Coding UniqueID# First Column Unique number used to identify each survey Each responder has a unique responder number from 1-30 SE-Marital Status Second Column Marital Status of Head of Household Not Married/Married SE-Income Third Column Total Annual Household Income Amount in US Dollars SE-AgeHeadHousehold Fourth Column Age of the Head of Household Age in Years SE-FamilySize Fifth Column Total Number of People in Family (Both Adults Number of People in Family and Children USD-Food Sixth Column Total Amount of Annual Expenditures on Food Amount in US Dollars USD-Meat Seventh Column Total Amount of Annual Expenditure on Meat Amount in US Dollars USD-Bakery Eighth Column Total Amount of Annual Expenditure on Bakery Amount in US Dollars USD-Fruits Ninth Column Total Amount of Annual Expenditure on Fruit Amount in US Dollars How to read the data set: Each row contains information from one household. For instance, the first row of the dataset starting on the next page shows us that: the head of household is not married and is 39 years old, has an annual household income of $96,727, a family size of 2, annual food expenditures of $7,051, and spends $904 on meat, $345 on bakery iterns, and $759 on fruit. UniqueID# SE-MaritalStatus SE-Income SE-AgeHeadHousehold SE-FamilySize USD-Food USD-Meat USD-Bakery USD-Fruits Not Married 96727 39 7051 904 345 759 Not Married 95366 48 7130 904 344 760Not Married 95432 51 7089 900 350 765 Not Married 96886 44 6982 917 359 752 Not Married 97469 35 6900 915 335 773 Not Married 95744 52 7040 906 353 753 Not Married 98717 40 7036 889 348 768 Not Married 94929 59 6948 899 345 771 9 Not Married 97912 49 6937 913 353 770 10 Not Married 96244 56 7073 918 338 773 11 Not Married 96621 54 2 7000 911 344 768 12 Not Married 97681 53 7097 921 341 767 13 Not Married 96597 49 AN 6971 898 357 779 14 Not Married 96522 43 6991 927 349 758 15 Not Married 96664 53 7051 906 346 772 16 Married 95208 52 8970 1116 452 979 17 Married 106622 49 10865 1554 534 1240 18 Married 95801 54 3 9395 1211 449 1018 19 Married 97611 44 9037 1147 449 994 20 Married 97835 30 1062 390 21 Married 107235 38 on U 8671 1005 10856 1322 549 1156 22 Married 101890 48 11089 1481 541 1157 23 Married 107511 56 10682 1428 564 1169 24 Married 95385 50 9101 1179 450 1001 25 Married 106627 56 10363 1561 585 1178 26 Married 107795 51 11278 1408 514 1231 27 Married 107338 67 11710 1533 541 1324 28 Married 105601 19 10330 1377 568 1098 29 Married 96362 37 8789 985 355 1146 30 Married 99610 36 NN $513 721 367 1025
Step by Step Solution
There are 3 Steps involved in it

Get step-by-step solutions from verified subject matter experts