

Question: Step 1: State the Null and Research Hypothesis: Step 2: Level of Significance is .05. Step 3: Compute the test statistic Step 4: Compare the
Step 1: State the Null and Research Hypothesis:
Step 2: Level of Significance is .05.
Step 3: Compute the test statistic
Step 4: Compare the Critical Value
Step 5: Decision:
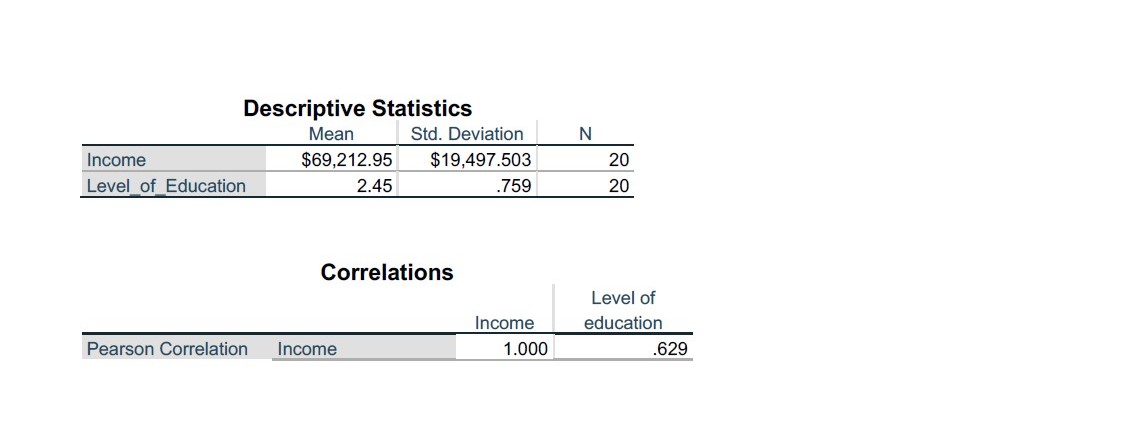
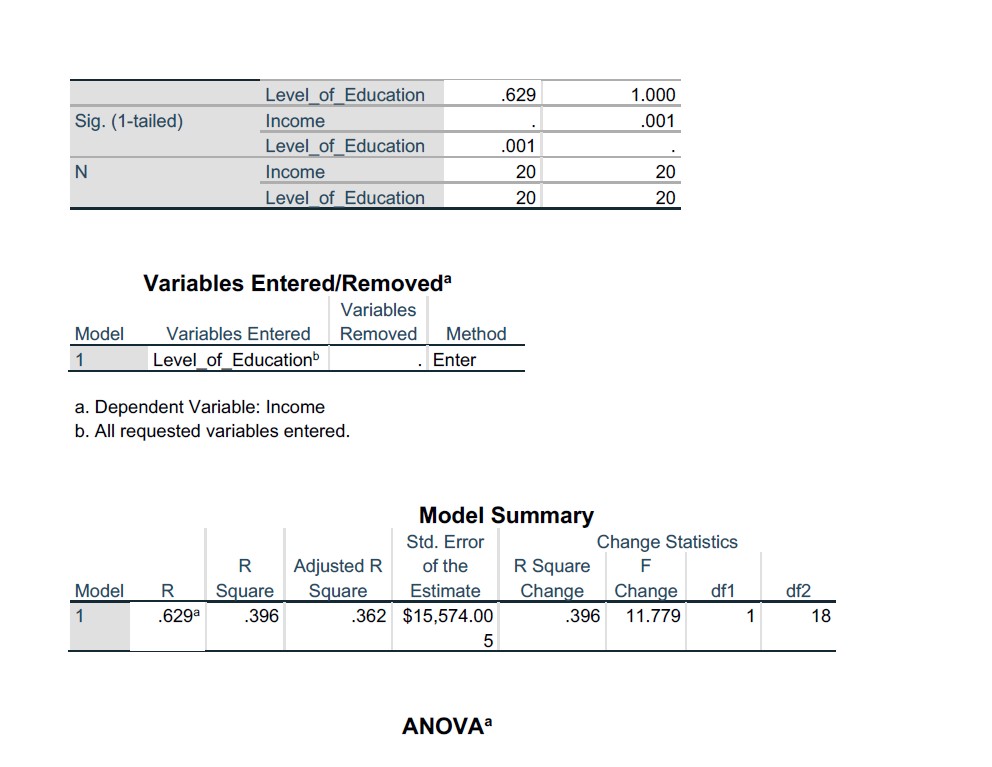
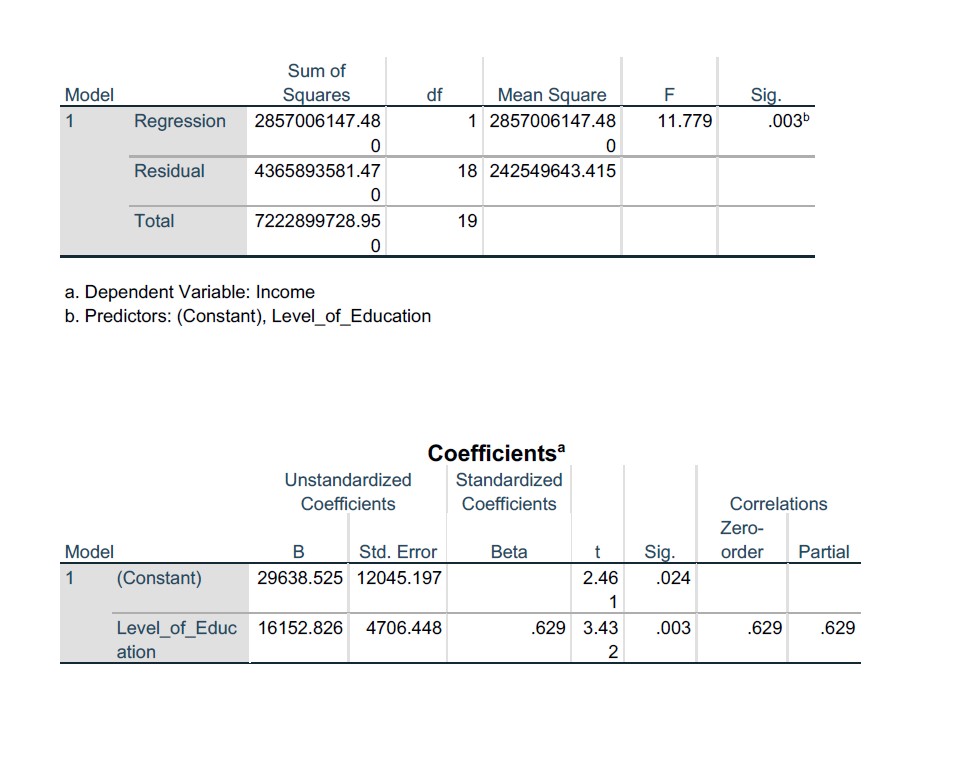
Descriptive Statistics Mean Std. Deviation Income $69,212.95 $19,497.503 Level of Education 2.45 759 Correlations Income Pearson Correlation Income 1.000 N 20 20 Level of education .629 Level of Education .629 1.000 Sig. (1-tailed) Income : .001 Level of Education .001 : N Income 20 20 Level of Education 20 20 Variables Entered/Removed? Variables Model Variables Entered Removed Method 1 Level of Education . Enter a. Dependent Variable: Income b. All requested variables entered. Model Summary Std. Error Change Statistics R Adjusted R of the R Square F Model R Square Square Estimate Change Change _ df1 df2 1 .629 .396 .362 $15,574.00 396 11.779 1 18 5 ANOVA? Sum of Model Squares df Mean Square F Sig. Regression 2857006147.48 1 2857006147.48 11.779 003b 0 0 Residual 4365893581.47 18 242549643.415 0 Total 7222899728.95 19 0 a. Dependent Variable: Income b. Predictors: (Constant), Level_of_Education Coefficients Unstandardized Standardized Coefficients Coefficients Correlations Zero- Model B Std. Error Beta t Sig. order Partial 1 (Constant) 29638.525 12045.197 2.46 024 Level of Educ 16152.826 4706.448 629 3.43 003 629 .629 ation 2
Step by Step Solution
There are 3 Steps involved in it

Get step-by-step solutions from verified subject matter experts