

Question: Step 1: Write the null and alternative hypotheses in symbols. Explain why hypotheses are expressed in terms of population parameters and not sample statistics? Possible
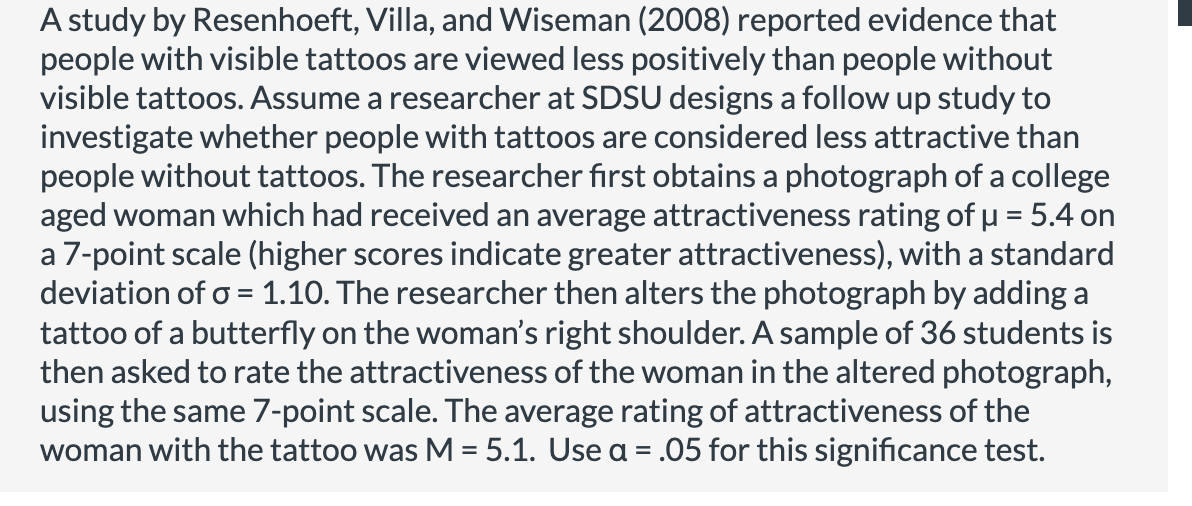
Step 1: Write the null and alternative hypotheses in symbols. Explain why hypotheses are expressed in terms of population parameters and not sample statistics? Possible symbols to copy and paste for your answer: H0, H1, p, M, 0'. A study by Resenhoeft, Villa, and Wiseman (2008) reported evidence that people with visible tattoos are viewed less positively than people without visible tattoos. Assume a researcher at SDSU designs a follow up study to investigate whether people with tattoos are considered less attractive than people without tattoos. The researcherrst obtains a photograph of a college aged woman which had received an average attractiveness rating of u = 5.4 on a 7-point scale (higher scores indicate greater attractiveness), with a standard deviation of o = 1.10. The researcher then alters the photograph by adding a tattoo of a buttery on the woman's right shoulder. A sample of 36 students is then asked to rate the attractiveness of the woman in the altered photograph, using the same 7-point scale. The average rating of attractiveness of the woman with the tattoo was M = 5.1. Use a = .05 for this signicance test. Step 2: Assume that we draw all possible random samples of 36 people from the population of all adults. What would be the appropriate standard error (SE) for a distribution of samples of size 36? Give an interpretation in words of what this number means
Step by Step Solution
There are 3 Steps involved in it

Get step-by-step solutions from verified subject matter experts