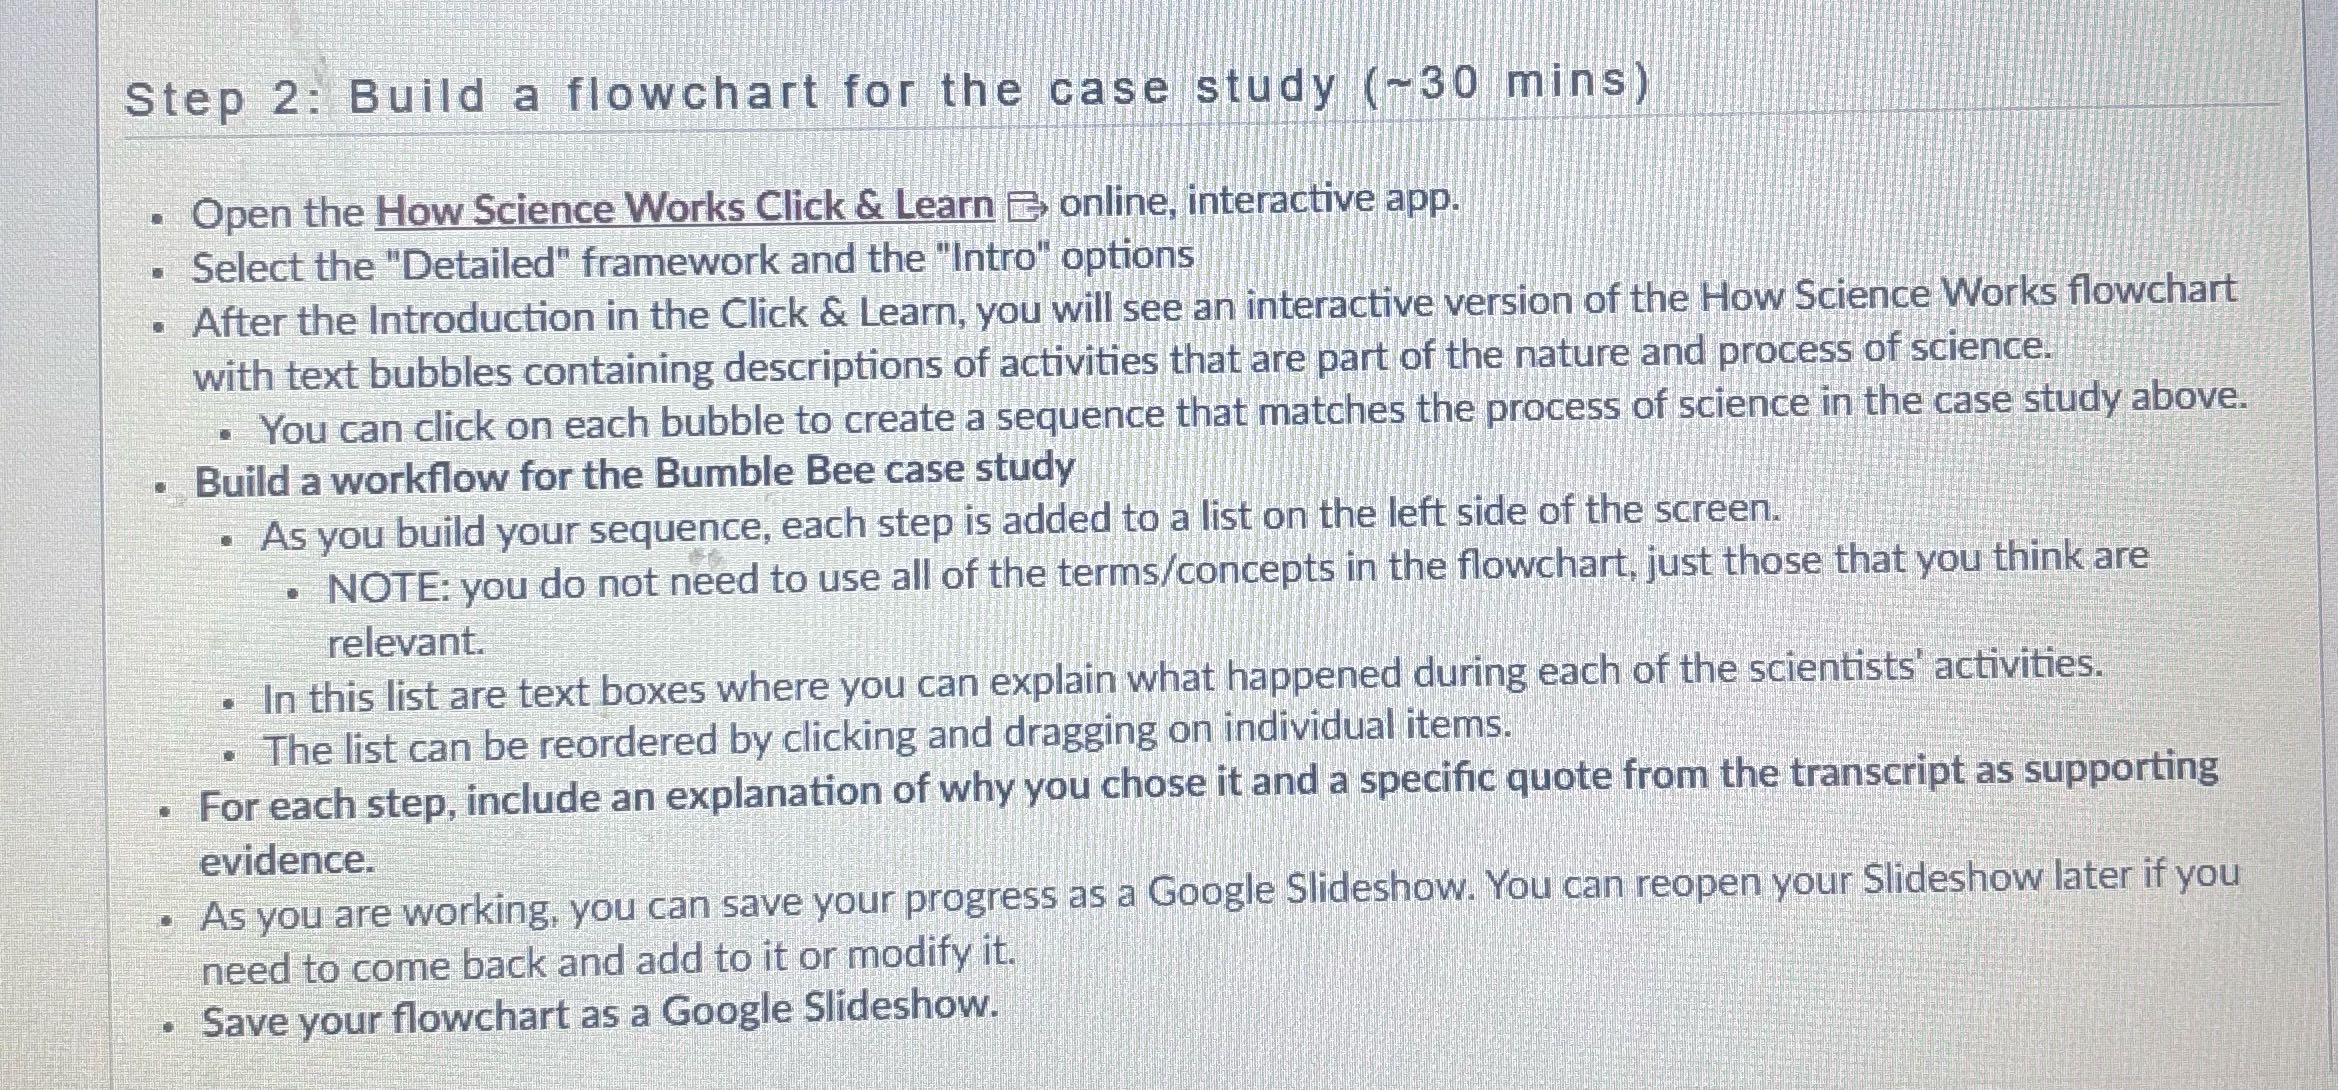
Question: Step 2: Build a flowchart for the case study (~30 mins) . Open the How Science Works Click & Learn _ online, interactive app. .

Step 2: Build a flowchart for the case study (~30
Step 2: Build a flowchart for the case study (~30 mins) . Open the How Science Works Click & Learn _ online, interactive app. . Select the "Detailed" framework and the "Intro" options . After the Introduction in the Click & Learn, you will see an interactive version of the How Science Works flowchart with text bubbles containing descriptions of activities that are part of the nature and process of science. . You can click on each bubble to create a sequence that matches the process of science in the case study above. . Build a workflow for the Bumble Bee case study . As you build your sequence, each step is added to a list on the left side of the screen. . NOTE: you do not need to use all of the terms/concepts in the flowchart, just those that you think are relevant. . In this list are text boxes where you can explain what happened during each of the scientists' activities. . The list can be reordered by clicking and dragging on individual items. . For each step, include an explanation of why you chose it and a specific quote from the transcript as supporting evidence. . As you are working, you can save your progress as a Google Slideshow. You can reopen your Slideshow later if you need to come back and add to it or modify it. . Save your flowchart as a Google Slideshow

Step by Step Solution

There are 3 Steps involved in it

1 Expert Approved Answer
Step: 1 Unlock blur-text-image
Question Has Been Solved by an Expert!

Get step-by-step solutions from verified subject matter experts

Step: 2 Unlock
Step: 3 Unlock

Students Have Also Explored These Related Accounting Questions!