

Question: Step 2: In regard to concession stand items, report the price and quantity you calculated in Questions 1 and 2 from Parts 1 and 2.
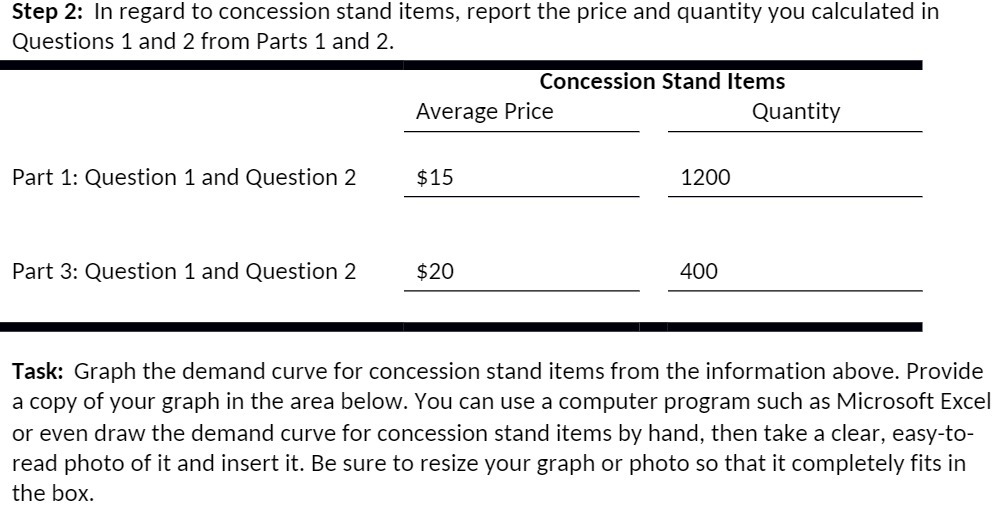
Step 2: In regard to concession stand items, report the price and quantity you calculated in Questions 1 and 2 from Parts 1 and 2. Concession Stand items Average Price Quantity Part 1: Question 1 and Question 2 $15 1200 Part 3: Question 1 and Question 2 $20 400 Task: Graph the demand curve for concession stand items from the information above. Provide a copy of your graph in the area below. You can use a computer program such as Microsoft Excel or even draw the demand curve for concession stand items by hand, then take a clear, easy-to- read photo of it and insert it. Be sure to resize your graph or photo so that it completely fits in the box
Step by Step Solution
There are 3 Steps involved in it

Get step-by-step solutions from verified subject matter experts