

Question: Step 2: Plot the Hurricane Path 0 Use the data from step 1 to make a table of the storm's horizontal and vertical movement with
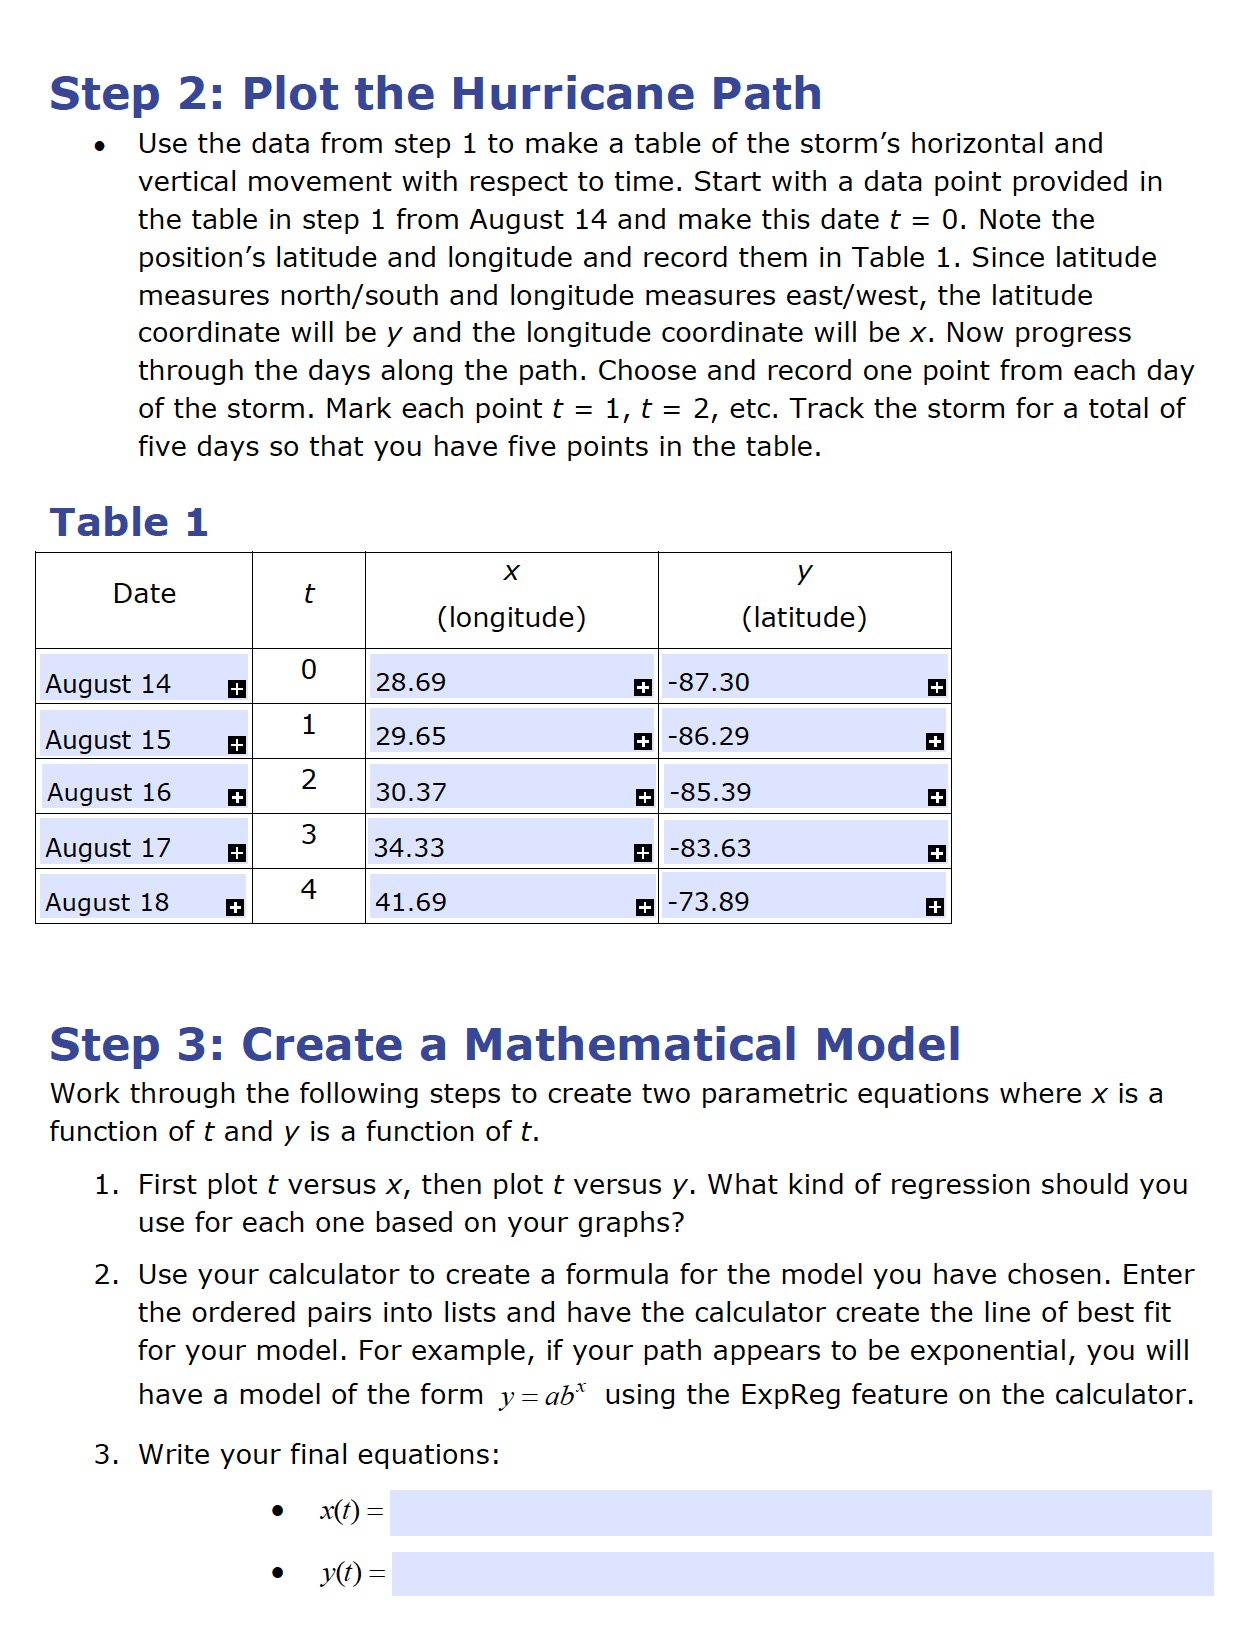
Step 2: Plot the Hurricane Path 0 Use the data from step 1 to make a table of the storm's horizontal and vertical movement with respect to time. Start with a data point provided in the table in step 1 from August 14 and make this date t = 0. Note the position's latitude and longitude and record them in Table 1. Since latitude measures north/south and longitude measures east/west, the latitude coordinate will be y and the longitude coordinate will be X. Now progress through the days along the path. Choose and record one point from each day of the storm. Mark each point t = 1, t = 2, etc. Track the storm for a total of five days so that you have five points in the table. Table 1 X 1/ Date t _ _ (longitude) (latitude) August 14 0 28.69 87.30 August 15 1 29.65 -86.29 August 16 2 30.37 -85.39 August 17 3 34.33 -83.63 August 13 n 4 41.69 73.89 Step 3: Create a Mathematical Model Work through the following steps to create two parametric equations where x is a function of t and y is a function of t. 1. First plot t versus x, then plot t versus y. What kind of regression should you use for each one based on your graphs? 2. Use your calculator to create a formula for the model you have chosen. Enter the ordered pairs into lists and have the calculator create the line of best fit for your model. For example, if your path appears to be exponential, you will have a model of the form y 2516" using the Epreg feature on the calculator. 3. Write your final equations: . x(f) : W) =
Step by Step Solution
There are 3 Steps involved in it

Get step-by-step solutions from verified subject matter experts