

Question: Step 2: Scatter Plot ( Spts) Use the following data provided in the table below to obtain a scatter plot of time vs. price. Describe
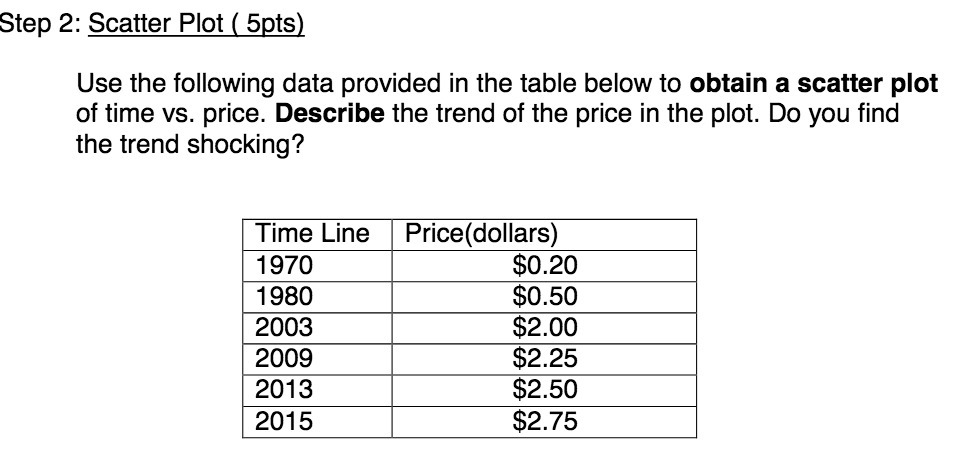
Step 2: Scatter Plot ( Spts) Use the following data provided in the table below to obtain a scatter plot of time vs. price. Describe the trend of the price in the plot. Do you find the trend shocking? Time Line Price(dollars) 1970 $0.20 $0.50 $2.00 $2.25 $2.50 $2.75
Step by Step Solution
There are 3 Steps involved in it
1 Expert Approved Answer
Step: 1 Unlock

Question Has Been Solved by an Expert!
Get step-by-step solutions from verified subject matter experts
Step: 2 Unlock
Step: 3 Unlock