

Question: Step 2. Using d , fill in the last two columns of the table. Participant Before After d d - 2 (a - 2 )
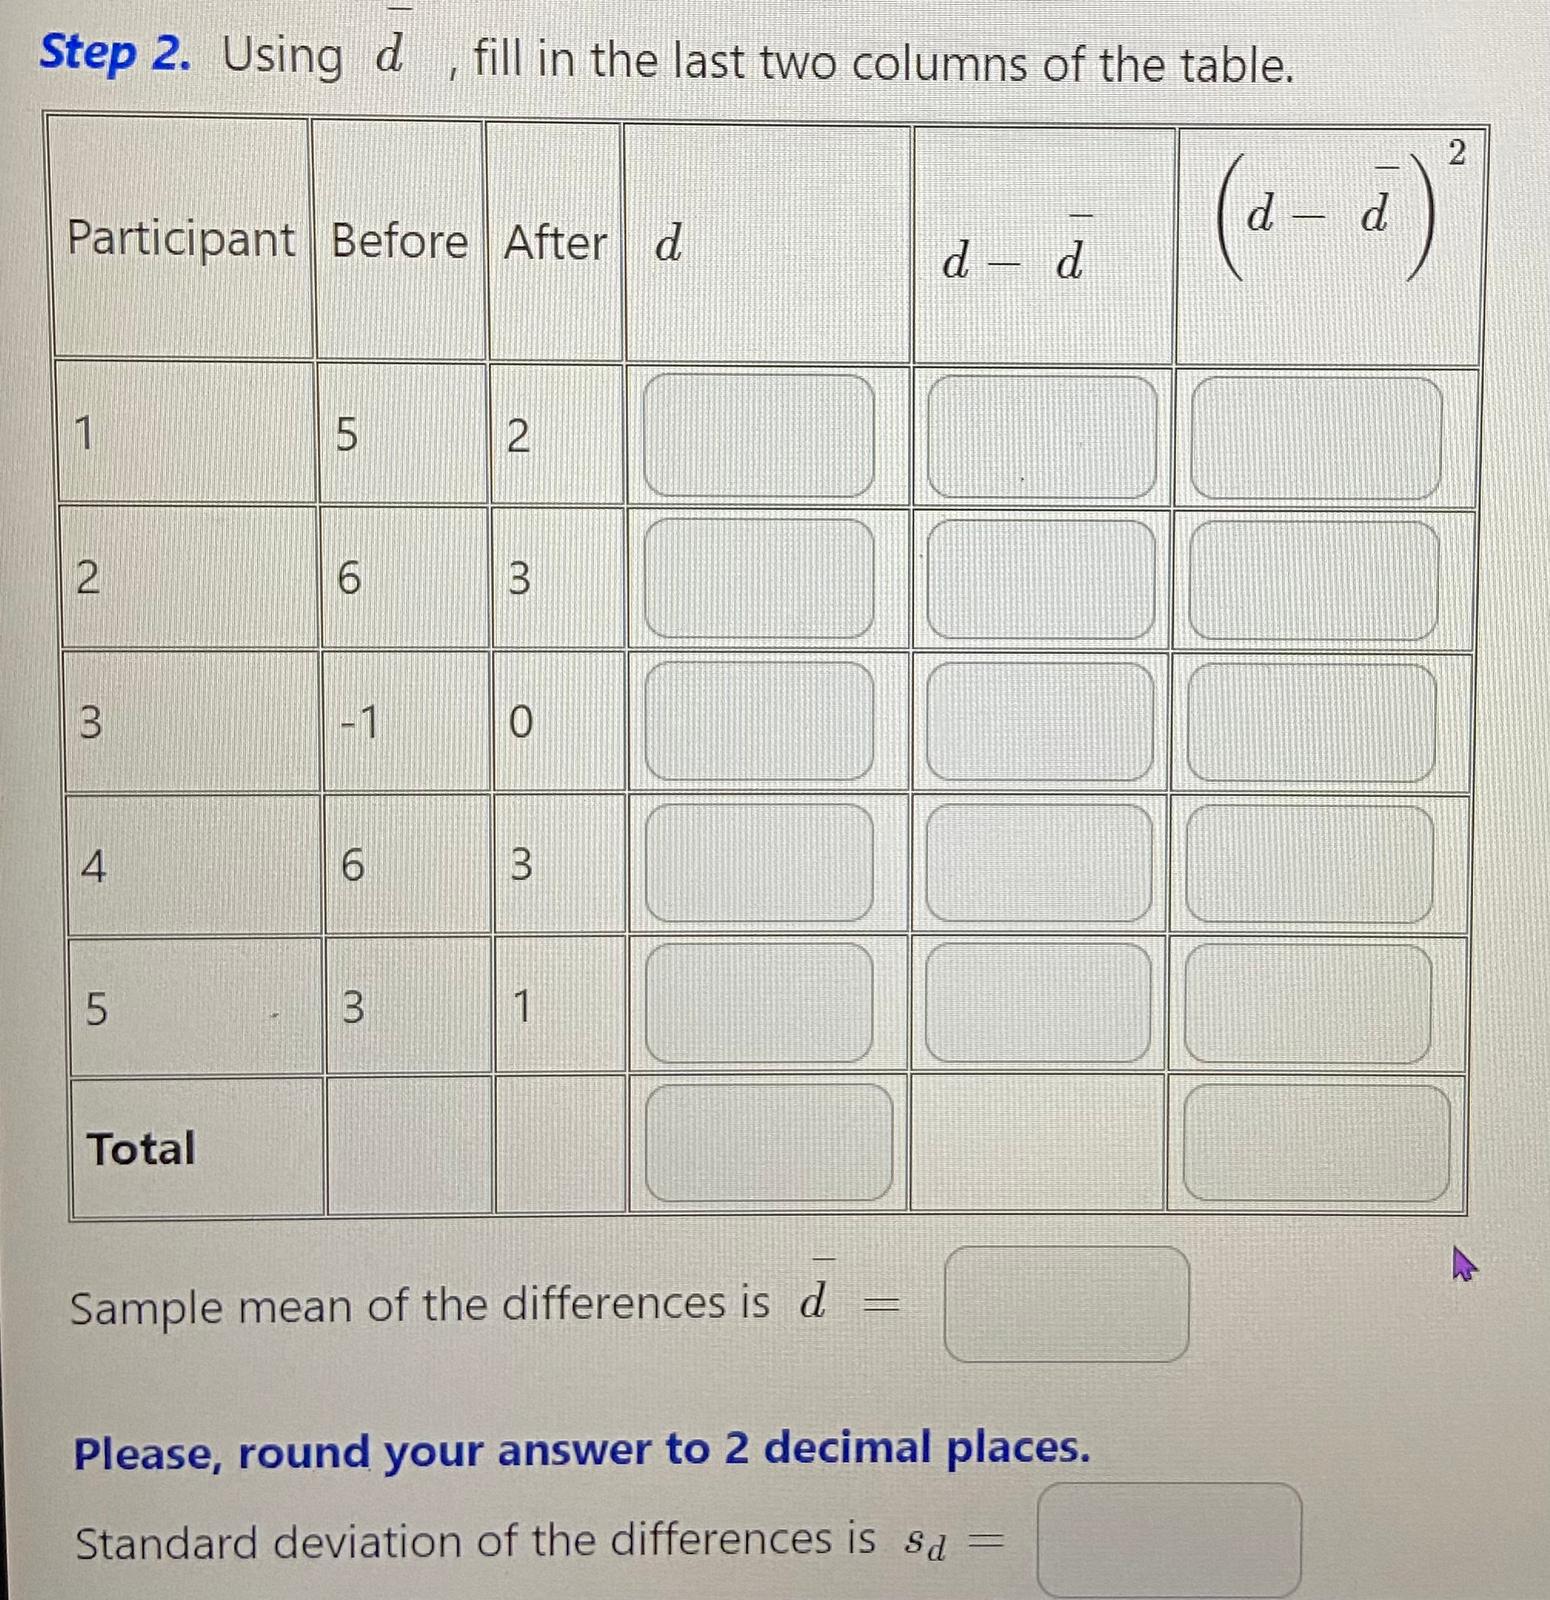
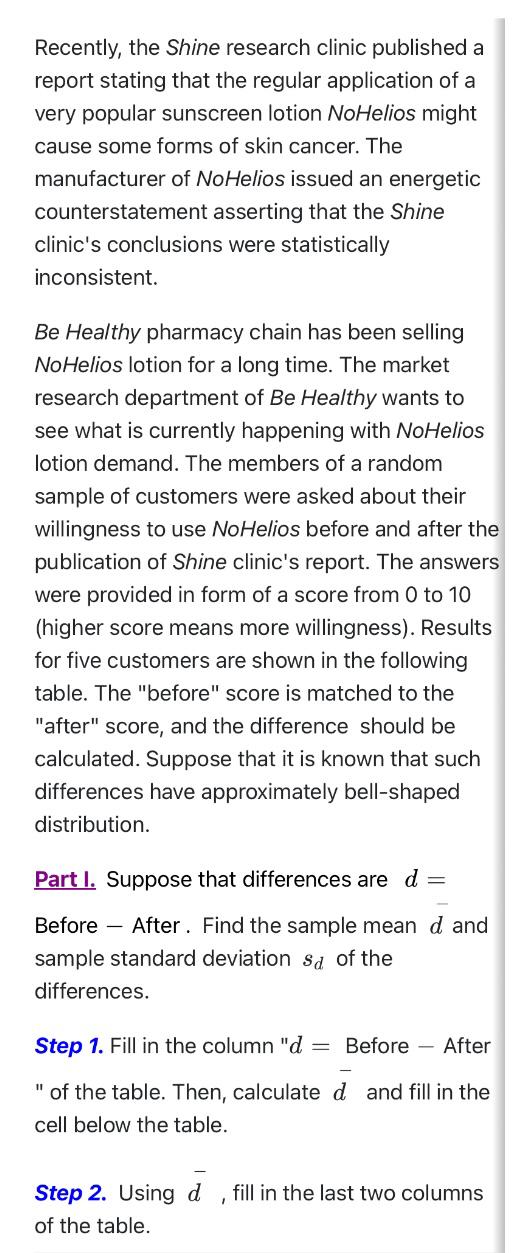
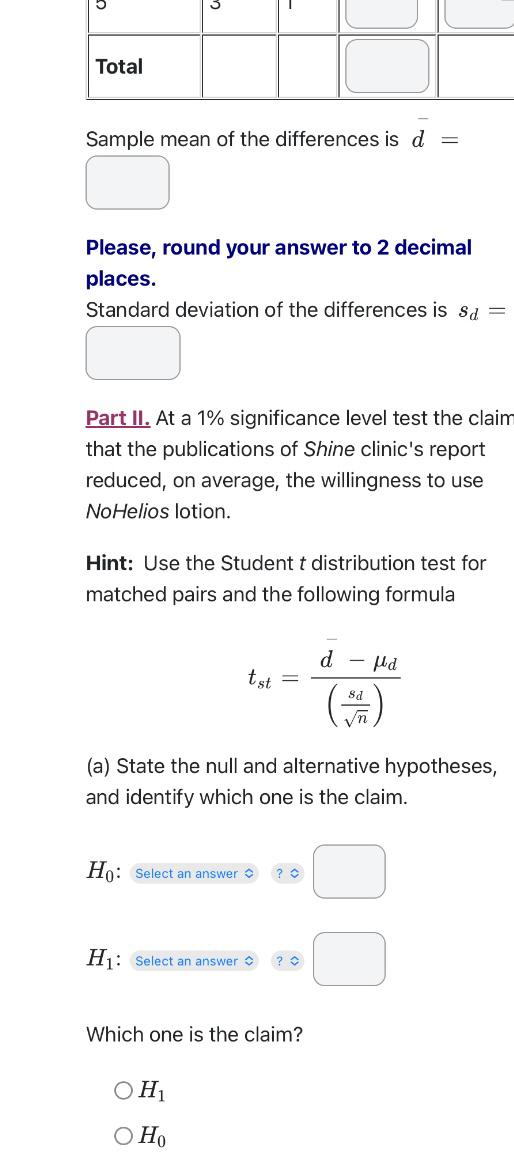
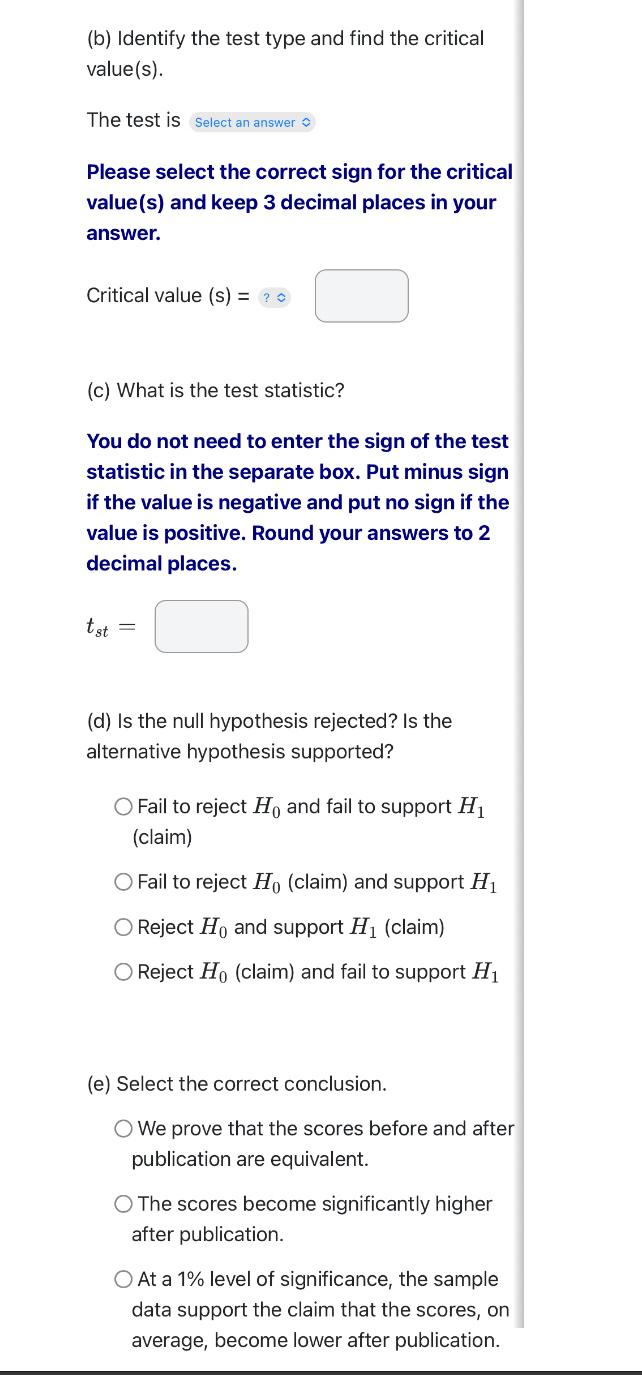
Step 2. Using d , fill in the last two columns of the table. Participant Before After d d - 2 (a - 2 ) 5 2 2 6 B B 0 4 6 B 5 B 1 Total Sample mean of the differences is d = Please, round your answer to 2 decimal places. Standard deviation of the differences is saRecently, the Shine research clinic published a report stating that the regular application of a veryr popular sunscreen lotion NoHe-lios might cause some forms of skin cancer. The manufacturer of NoHelfos issued an energetic counterstatement asserting that the Shine clinic's conclusions were statistically inconsistent. Be Healthy pharmacy chain has been selling NoHelfos lotion for a long time- The market research department of Be Healthy wants to see what is currently happening with NoHelfos lotion demand. The members of a random sample of customers were asked about their willingness to use NoHelios before and after the publication of Shine clinic's report. The answers were provided in form of a score from 0 to 10 (higher score means more willingness). Results for five customers are shown in the following table. The "before" score is matched to the "after" score, and the difference should be calculated. Suppose that it is known that such differences have approximately bell-shaped distribution. Part I. Suppose that differences are d : Before After. Find the sample mean of and sample standard deviation saw, of the differences. Step 1'. Fill in the column "d : Before After " of thetable. Then, calculate d and fill in the cell below the table. Step 2. Using d ,fill in thelast two columns of the table. Total Sample mean of the differences is d = Please, round your answer to 2 decimal places. Standard deviation of the differences is Sd = Part II. At a 1% significance level test the claim that the publications of Shine clinic's report reduced, on average, the willingness to use NoHelios lotion. Hint: Use the Student t distribution test for matched pairs and the following formula d - Ud tst = Sd (a) State the null and alternative hypotheses, and identify which one is the claim. Ho: Select an answer ?0 H1: Select an answer ?0 Which one is the claim? OH1 OHo(to) Identify the test type and find the critical value(s). The test is Select an answer 3 Please select the correct sign for the critical value(s) and keep 3 decimal places in your answer. Critical value (5) : '9 e (c) What is the test statistic? You do not need to enter the sign of the test statistic in the separate box. Put minus sign if the value is negative and put no sign it the value is positive. Round your answers to 2 decimal places. tan) 2 (d) Is the null hypothesis rejected? Is the alternative hypothesis supported? O Fail to reject H0 and fail to support H1 (claim) 0 Fail to reject H\" (claim) and support H1 O Reject H0 and support H1 (claim) 0 Reject H0 (claim) and fail to support H1 {e} Select the correct conclusion. C) We prove that the Scores before and after publication are equivalent. 0 The scores become significantly higher after publication. D At a 1% level of significance, the sample data support the claim that the scores, on average, become lower after publication
Step by Step Solution
There are 3 Steps involved in it

Get step-by-step solutions from verified subject matter experts