

Question: Step 3: Use the Downloaded Excel File 1. Open the Excel file that you downloaded from ProBanker. 2. Click on the Bank 1 tab. (For
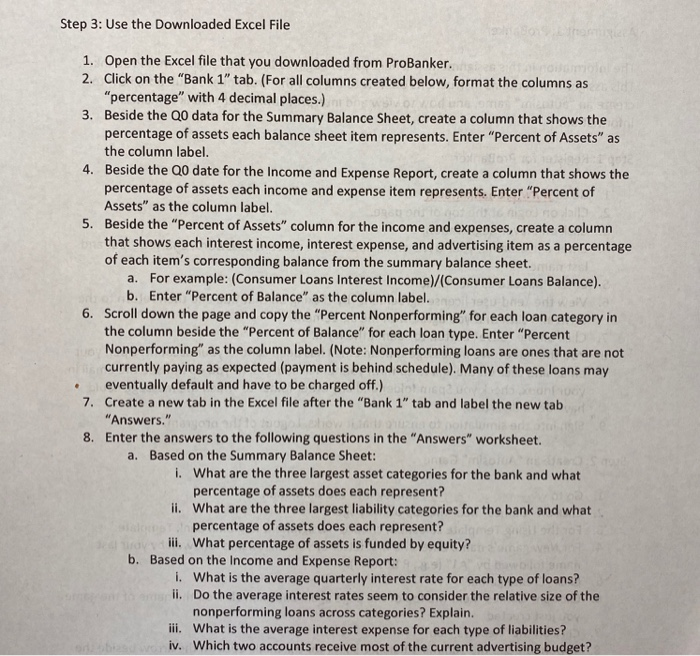
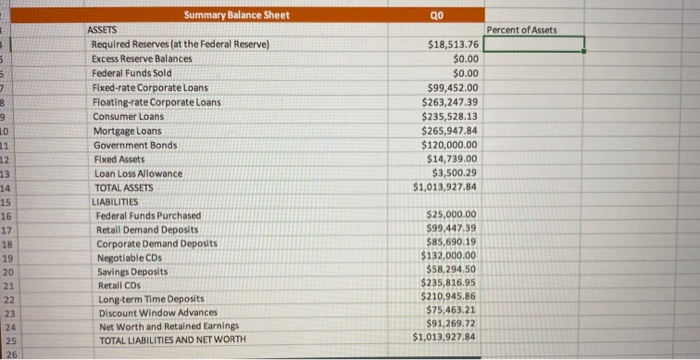
Step 3: Use the Downloaded Excel File 1. Open the Excel file that you downloaded from ProBanker. 2. Click on the "Bank 1" tab. (For all columns created below, format the columns as "percentage" with 4 decimal places.) 3. Beside the QO data for the Summary Balance Sheet, create a column that shows the percentage of assets each balance sheet item represents. Enter "Percent of Assets" as the column label. 4. Beside the QO date for the income and Expense Report, create a column that shows the percentage of assets each income and expense item represents. Enter "Percent of Assets" as the column label. 5. Beside the "Percent of Assets" column for the income and expenses, create a column that shows each interest income, interest expense, and advertising item as a percentage of each item's corresponding balance from the summary balance sheet. a. For example: (Consumer Loans Interest Income)/(Consumer Loans Balance). b. Enter "Percent of Balance" as the column label. 6. Scroll down the page and copy the "Percent Nonperforming" for each loan category in the column beside the "Percent of Balance" for each loan type. Enter "Percent Nonperforming" as the column label. (Note: Nonperforming loans are ones that are not currently paying as expected (payment is behind schedule). Many of these loans may eventually default and have to be charged off.) 7. Create a new tab in the Excel file after the "Bank 1" tab and label the new tab "Answers." 8. Enter the answers to the following questions in the "Answers" worksheet. a. Based on the Summary Balance Sheet: 1. What are the three largest asset categories for the bank and what percentage of assets does each represent? II. What are the three largest liability categories for the bank and what percentage of assets does each represent? iii. What percentage of assets is funded by equity? b. Based on the Income and Expense Report: 1. What is the average quarterly interest rate for each type of loans? ii. Do the average interest rates seem to consider the relative size of the nonperforming loans across categories? Explain. ill. What is the average interest expense for each type of liabilities? iv. Which two accounts receive most of the current advertising budget? Qo Percent of Assets Summary Balance Sheet ASSETS Required Reserves (at the Federal Reserve) Excess Reserve Balances Federal Funds Sold Fixed-rate Corporate Loans Floating-rate Corporate Loans Consumer Loans Mortgage Loans Government Bonds Fixed Assets Loan Loss Allowance TOTAL ASSETS LIABILITIES Federal Funds Purchased Retail Demand Deposits Corporate Demand Deposits Negotiable CDs Savings Deposits Retail CDs Long-term Time Deposits Discount Window Advances Net Worth and Retained Earnings TOTAL LIABILITIES AND NET WORTH $18,513.76 $0.00 $0.00 $99,452.00 $263,247.39 $235,528.13 $265,947.84 $120,000.00 $14,739.00 $3,500.29 $1,013,927.84 FANNS $25,000.00 $99,447.39 $85,690.19 $132,000.00 $58,294.50 $ 235,816.95 $210,945.86 $ 75,463.21 $91,269.72 $1,013,927.84 Step 3: Use the Downloaded Excel File 1. Open the Excel file that you downloaded from ProBanker. 2. Click on the "Bank 1" tab. (For all columns created below, format the columns as "percentage" with 4 decimal places.) 3. Beside the QO data for the Summary Balance Sheet, create a column that shows the percentage of assets each balance sheet item represents. Enter "Percent of Assets" as the column label. 4. Beside the QO date for the income and Expense Report, create a column that shows the percentage of assets each income and expense item represents. Enter "Percent of Assets" as the column label. 5. Beside the "Percent of Assets" column for the income and expenses, create a column that shows each interest income, interest expense, and advertising item as a percentage of each item's corresponding balance from the summary balance sheet. a. For example: (Consumer Loans Interest Income)/(Consumer Loans Balance). b. Enter "Percent of Balance" as the column label. 6. Scroll down the page and copy the "Percent Nonperforming" for each loan category in the column beside the "Percent of Balance" for each loan type. Enter "Percent Nonperforming" as the column label. (Note: Nonperforming loans are ones that are not currently paying as expected (payment is behind schedule). Many of these loans may eventually default and have to be charged off.) 7. Create a new tab in the Excel file after the "Bank 1" tab and label the new tab "Answers." 8. Enter the answers to the following questions in the "Answers" worksheet. a. Based on the Summary Balance Sheet: 1. What are the three largest asset categories for the bank and what percentage of assets does each represent? II. What are the three largest liability categories for the bank and what percentage of assets does each represent? iii. What percentage of assets is funded by equity? b. Based on the Income and Expense Report: 1. What is the average quarterly interest rate for each type of loans? ii. Do the average interest rates seem to consider the relative size of the nonperforming loans across categories? Explain. ill. What is the average interest expense for each type of liabilities? iv. Which two accounts receive most of the current advertising budget? Qo Percent of Assets Summary Balance Sheet ASSETS Required Reserves (at the Federal Reserve) Excess Reserve Balances Federal Funds Sold Fixed-rate Corporate Loans Floating-rate Corporate Loans Consumer Loans Mortgage Loans Government Bonds Fixed Assets Loan Loss Allowance TOTAL ASSETS LIABILITIES Federal Funds Purchased Retail Demand Deposits Corporate Demand Deposits Negotiable CDs Savings Deposits Retail CDs Long-term Time Deposits Discount Window Advances Net Worth and Retained Earnings TOTAL LIABILITIES AND NET WORTH $18,513.76 $0.00 $0.00 $99,452.00 $263,247.39 $235,528.13 $265,947.84 $120,000.00 $14,739.00 $3,500.29 $1,013,927.84 FANNS $25,000.00 $99,447.39 $85,690.19 $132,000.00 $58,294.50 $ 235,816.95 $210,945.86 $ 75,463.21 $91,269.72 $1,013,927.84
Step by Step Solution
There are 3 Steps involved in it

Get step-by-step solutions from verified subject matter experts