

Question: STEP 4: Check for missing values and display the results as a series of bar charts that are either royal blue or dark orange. Your
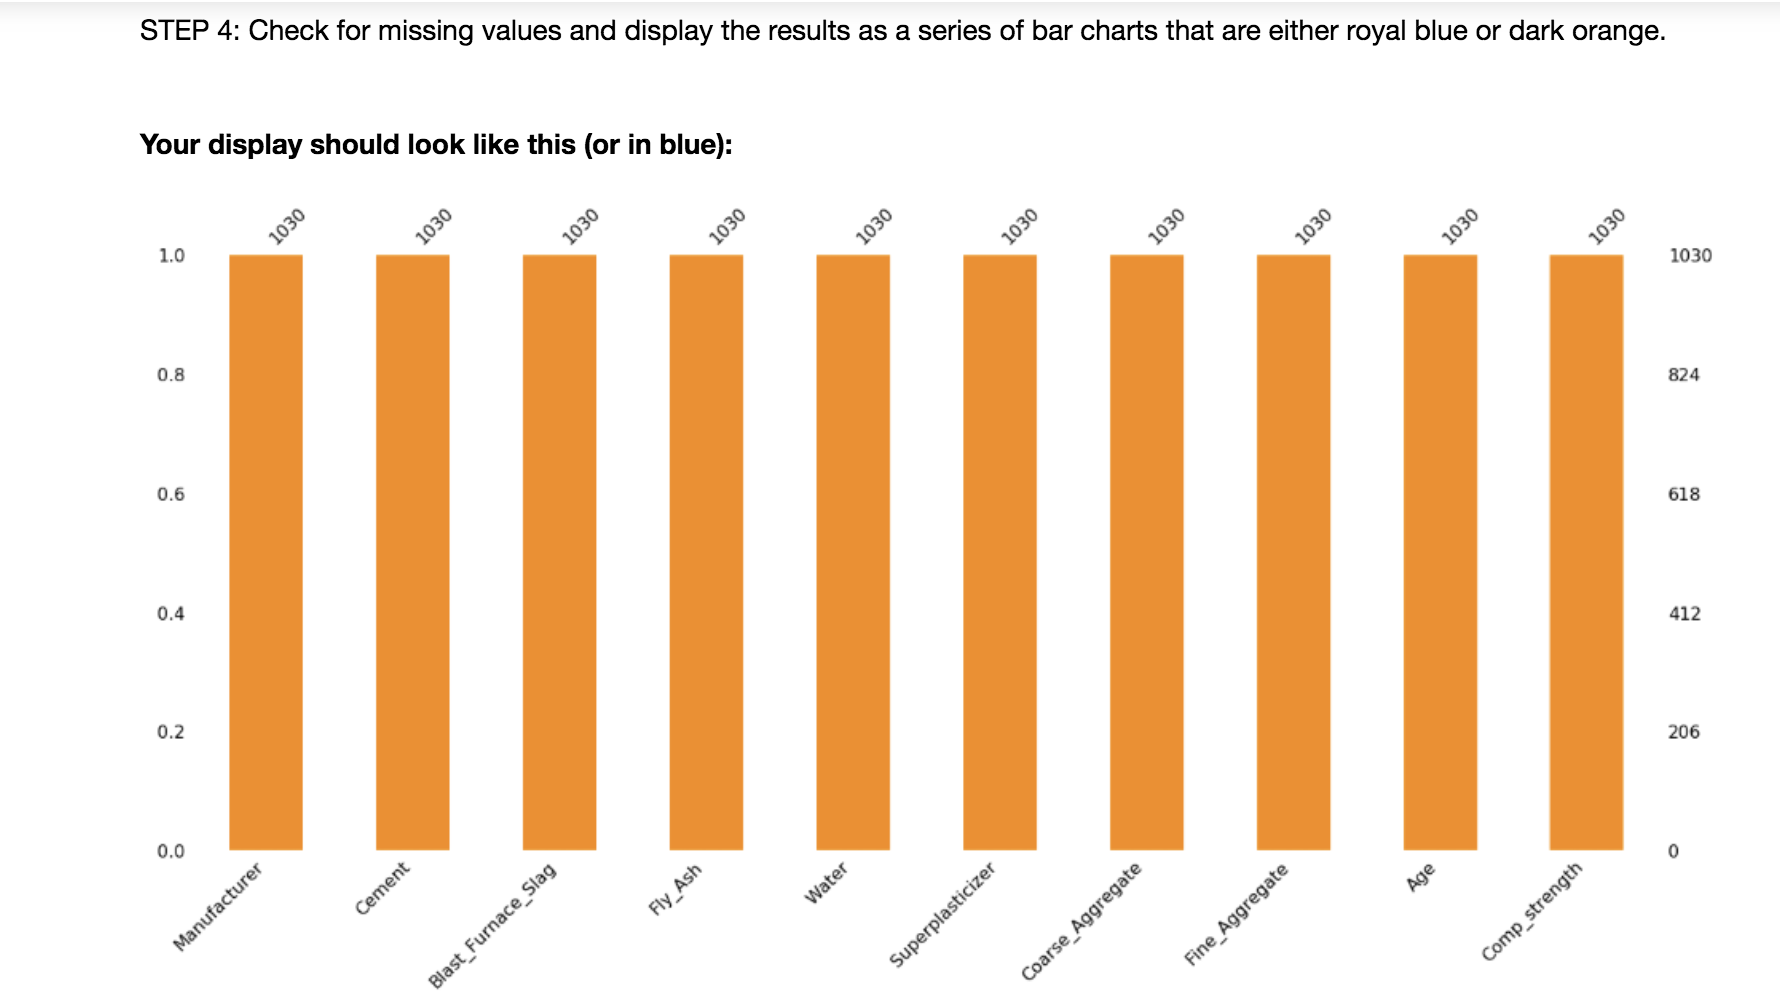
STEP 4: Check for missing values and display the results as a series of bar charts that are either royal blue or dark orange. Your display should look like this (or in blue): 1030 1030 1030 1030 1030 1030 Age Water Fly Ash Cement Superplasticizer Manufacturer Fine Aggregate Comp strength Blast_Furnace_Slag Coarse Aggregate STEP 4: Check for missing values and display the results as a series of bar charts that are either royal blue or dark orange. Your display should look like this (or in blue): 1030 1030 1030 1030 1030 1030 Age Water Fly Ash Cement Superplasticizer Manufacturer Fine Aggregate Comp strength Blast_Furnace_Slag Coarse Aggregate
Step by Step Solution
There are 3 Steps involved in it

Get step-by-step solutions from verified subject matter experts