

Question: Step 4: Scatterplot and Correlation for the Total Number of Wins and Average Relative Skill Your management expects the team to win more games in
Step 4: Scatterplot and Correlation for the Total Number of Wins and Average Relative Skill
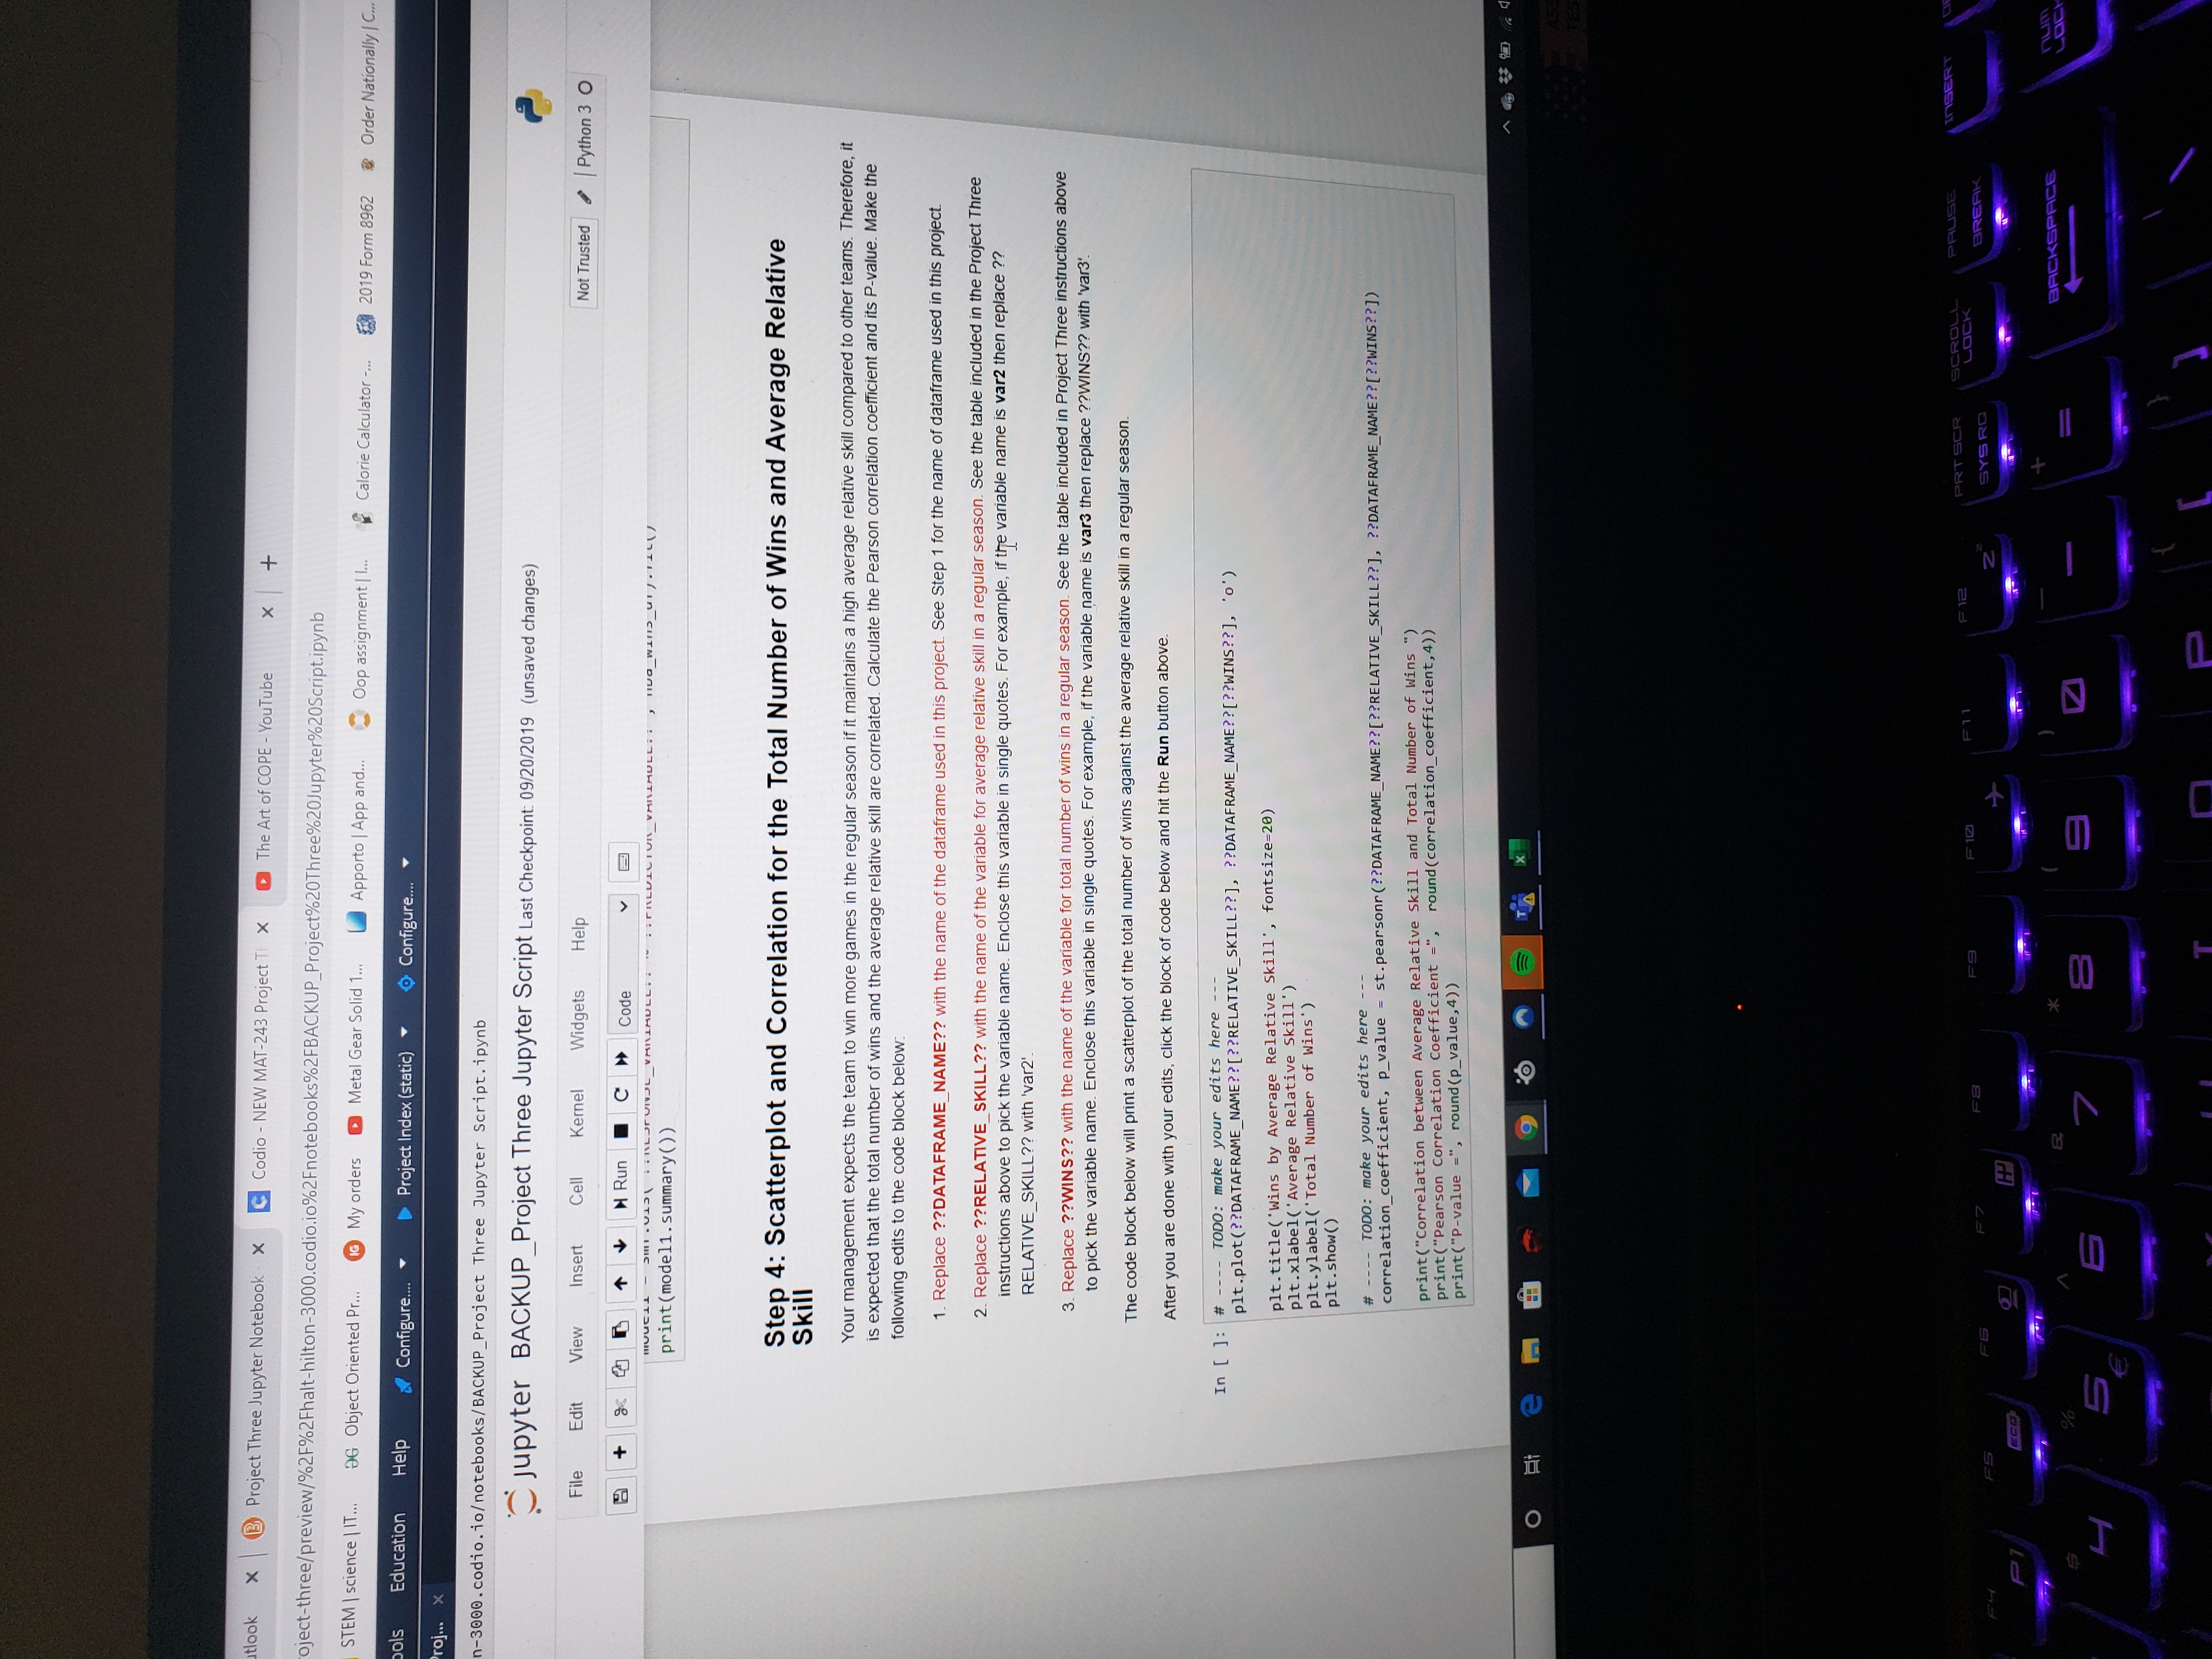
Your management expects the team to win more games in the regular season if it maintains a high average relative skill compared to other teams. Therefore, it is expected that the total number of wins and the average relative skill are correlated. Calculate the Pearson correlation coefficient and its P-value. Make the following edits to the code block below:
- Replace??DATAFRAME_NAME??with the name of the dataframe used in this project.See Step 1 for the name of dataframe used in this project.
- Replace??RELATIVE_SKILL??with the name of the variable for average relative skill in a regular season.See the table included in the Project Three instructions above to pick the variable name. Enclose this variable in single quotes. For example, if the variable name isvar2then replace ??RELATIVE_SKILL?? with 'var2'.
- Replace??WINS??with the name of the variable for total number of wins in a regular season.See the table included in Project Three instructions above to pick the variable name. Enclose this variable in single quotes. For example, if the variable name isvar3then replace ??WINS?? with 'var3'.
The code block below will print a scatterplot of the total number of wins against the average relative skill in a regular season.
After you are done with your edits, click the block of code below and hit theRunbutton above.
# ---- TODO: make your edits here ---
plt.plot(??DATAFRAME_NAME??[??RELATIVE_SKILL??], ??DATAFRAME_NAME??[??WINS??], 'o')
plt.title('Wins by Average Relative Skill', fontsize=20)
plt.xlabel('Average Relative Skill')
plt.ylabel('Total Number of Wins')
plt.show()
# ---- TODO: make your edits here ---
correlation_coefficient, p_value = st.pearsonr(??DATAFRAME_NAME??[??RELATIVE_SKILL??], ??DATAFRAME_NAME??[??WINS??])
print("Correlation between Average Relative Skill and Total Number of Wins ")
print("Pearson Correlation Coefficient =",round(correlation_coefficient,4))
print("P-value =", round(p_value,4))
itlook X B Project Three Jupyter Notebook x C Codio - NEW MAT-243 Project T x The Art of COPE - YouTube * + oject-three/preview/%2F%2Fhalt-hilton-3000.codio.io%2Fnotebooks%2FBACKUP_Project%20Three%20Jupyter%20Script.ipynb STEM | science | IT... DG Object Oriented Pr... IG My orders Metal Gear Solid 1... Apporto | App and... Oop assignment | 1... Calorie Calculator -.. 2019 Form 8962 Order Nationally | C pols Education Help Configure.. Project Index (static) Configure.. "OJ... 1-3000 . codio. io/ notebooks/BACKUP_Project Three Jupyter Script. ipynb Jupyter BACKUP_Project Three Jupyter Script Last Checkpoint: 09/20/2019 (unsaved changes) File Edit View Insert Cell Kernel Widgets Help Not Trusted | Python 3 0 a + 8 5 1 6 Run C | Code print (model1 . summary ( ) ) ANTI. / In CHITM DAIL Step 4: Scatterplot and Correlation for the Total Number of Wins and Average Relative Skill Your management expects the team to win more games in the regular season if it maintains a high average relative skill compared to other teams. Therefore, it is expected that the total number of wins and the average relative skill are correlated. Calculate the Pearson correlation coefficient and its P-value. Make the following edits to the code block below: 1. Replace ??DATAFRAME_NAME?? with the nam project. See Step 1 for the name of dataframe used in this project. 2. Replace ??RELATIVE_SKILL?? with the name of the variable for average relative skill in a regular season. See the table included in the Project Three instructions above to pick the variable name. Enclose this variable in single quotes. For example, if the variable name is var2 then replace ?? RELATIVE_SKILL?? with 'var2' 3. Replace ??WINS?? with the name of the variable for total number of wins in a regular season. See the table included in Project Three instructions above to pick the variable name. Enclose this variable in single quotes. For example, if the variable name is var3 then replace ??WINS?? with 'var3'. The code block below will print a scatterplot of the total number of wins against the average relative skill in a regular season. After you are done with your edits, click the block of code below and hit the Run button above. In [ ]: # - ---- TODO: make your edits here --- plt.plot(? ?DATAFRAME_NAME? ? [ ? ?RELATIVE_SKILL? ? ], ??DATAFRAME_NAME? ? [ ? ?WINS? ? ], '.' ) pit. title( wins by 'Wins by Average Relative Skill', fontsize=20) pit.xlabel( ' Average Relative Skill' ) pit.ylabel( ' Total Number of Wins' ) pit . show( ) ---- TODO: make your edits here - correlation_coefficient, p_value = st. pearsonr(??DATAFRAME_NAME? ? [ ??RELATIVE_SKILL?? ], ??DATAFRAME_NAME? ? [? ?WINS? ? ]) print("Correlation between Average Relative Skill and Total Number of Wins ") print("Pearson Correlation Co round (correlation_coefficient, 4) ) print("P-value =", round(p_value, 4) ) O F11 F 12 PRT SCR SCROLL LOCK PAUSE ISERT F5 F / SYS RO BREAK BACKSPACE LOC L 5 E
Step by Step Solution
There are 3 Steps involved in it

Get step-by-step solutions from verified subject matter experts