

Question: STEP 9b: Create and run a predictive linear re gression model on the training data. Print out the summary regression performance results on the training
STEP 9b: Create and run a predictive linear re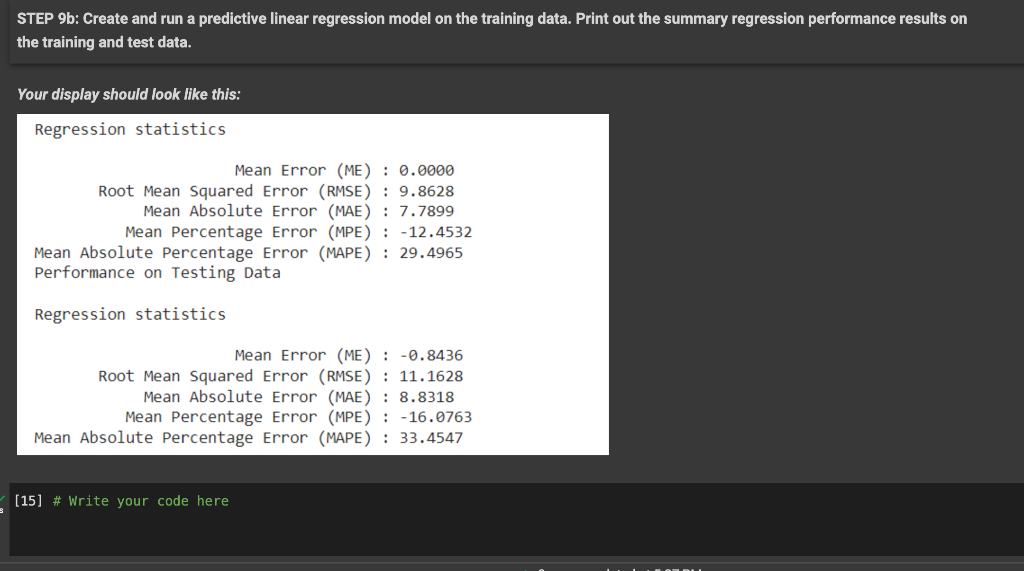 gression model on the training data. Print out the summary regression performance results on the training and test data.
Tour display should look like this: Regression statistics Mean Error (ME) : 0.0000 Root Mean Squared Error (RMSE) : 9.8628 Mean Absolute Error (MAE) : 7.7899 Mean Percentage Error (MPE) : -12.4532 Mean Absolute Percentage Error (MAPE) : 29.4965 Performance on Testing Data Regression statistics Mean Error (ME) : -0.8436 Root Mean Squared Error (RMSE) : 11.1628 Mean Absolute Error (MAE) : 8.8318 Mean Percentage Error (MPE) : -16.0763 Mean Absolute Percentage Error (MAPE) : 33.4547 Tour display should look like this: Regression statistics Mean Error (ME) : 0.0000 Root Mean Squared Error (RMSE) : 9.8628 Mean Absolute Error (MAE) : 7.7899 Mean Percentage Error (MPE) : -12.4532 Mean Absolute Percentage Error (MAPE) : 29.4965 Performance on Testing Data Regression statistics Mean Error (ME) : -0.8436 Root Mean Squared Error (RMSE) : 11.1628 Mean Absolute Error (MAE) : 8.8318 Mean Percentage Error (MPE) : -16.0763 Mean Absolute Percentage Error (MAPE) : 33.4547
Step by Step Solution
There are 3 Steps involved in it

Get step-by-step solutions from verified subject matter experts