

Question: step aby step calculations with graph Question 1) A research study was conducted to examine the clinical efficacy of a new antidepressant. Depressed patients were
step aby step calculations with graph
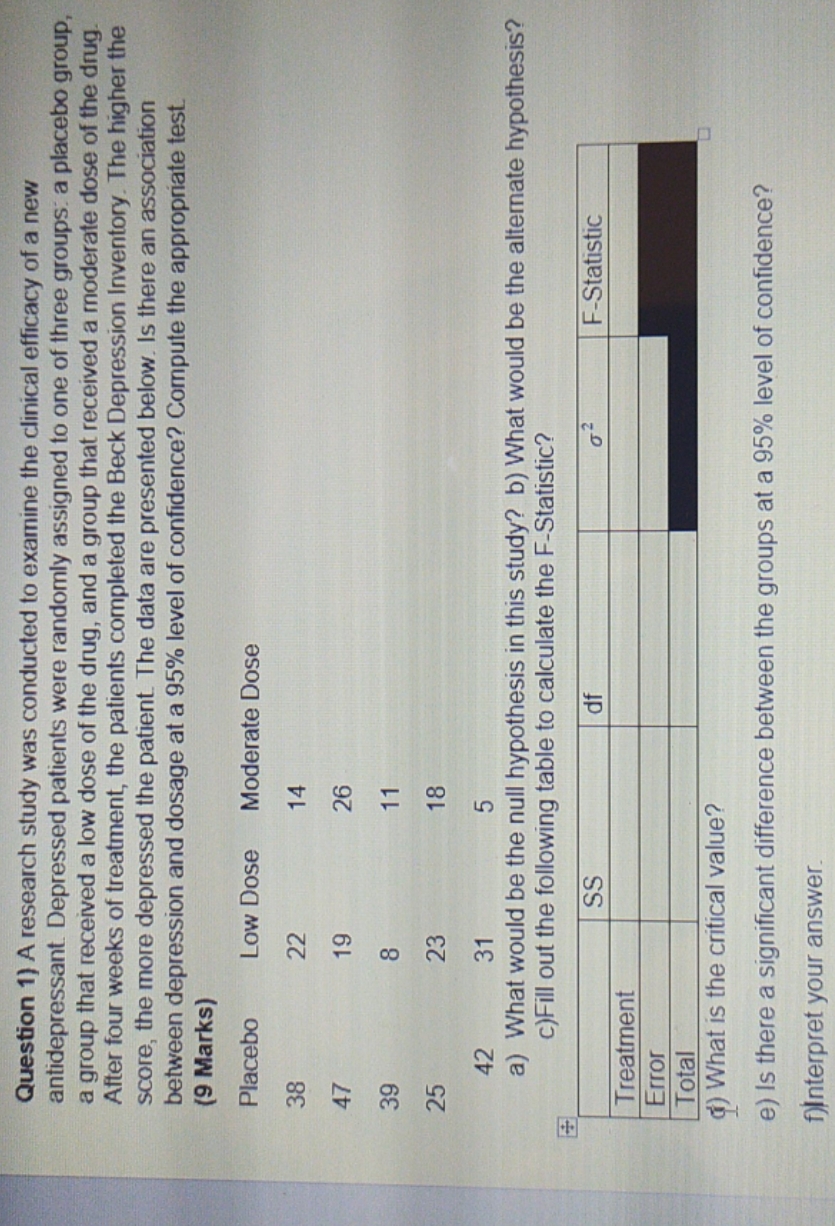
Question 1) A research study was conducted to examine the clinical efficacy of a new antidepressant. Depressed patients were randomly assigned to one of three groups: a placebo group a group that received a low dose of the drug, and a group that received a moderate dose of the drug After four weeks of treatment, the patients completed the Beck Depression Inventory. The higher the score, the more depressed the patient. The data are presented below. Is there an association between depression and dosage at a 95% level of confidence? Compute the appropriate test. (9 Marks) Placebo Low Dose Moderate Dose 8 CO a) What would be the null hypothesis in this study? b) What would be the alternate hypothesis? c)Fill out the following table to calculate the F-Statistic? F-Statistic Treatment Error Total () What is the critical value? e) Is there a significant difference between the groups at a 95% level of confidence? f)Interpret your
Step by Step Solution
There are 3 Steps involved in it

Get step-by-step solutions from verified subject matter experts