

Question: step by step , and solve in graph the Question below the graph Fig Q3 shows the drying graph of a solid. The drying happens
step by step , and solve in graph 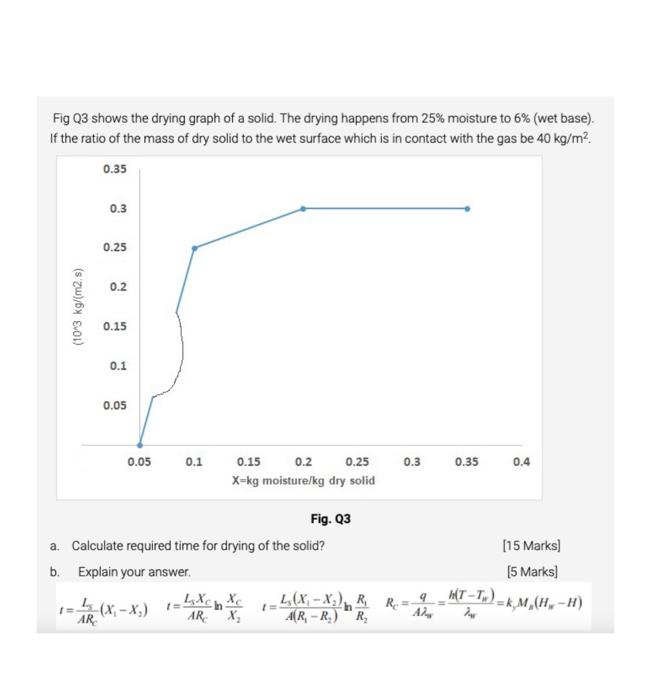
the Question below the graph
Fig Q3 shows the drying graph of a solid. The drying happens from 25% moisture to 6% (wet base). If the ratio of the mass of dry solid to the wet surface which is in contact with the gas be 40kg/m2. Fig. Q3 a. Calculate required time for drying of the solid? [15 Marks] b. Explain your answer. [ 5 Marks] t=ARCLS(X1X2)t=ARCLsXClnX2XCt=A(R1R2)L5(X1X2)hR2R1RC=Asq=kh(TTH)=kyMM(HHH)
Step by Step Solution
There are 3 Steps involved in it
1 Expert Approved Answer
Step: 1 Unlock

Question Has Been Solved by an Expert!
Get step-by-step solutions from verified subject matter experts
Step: 2 Unlock
Step: 3 Unlock