

Question: step by step excel solution Search or type a command Homework 3 Immersive Reader Op 3. Plot a u chart for the following data and
step by step excel solution
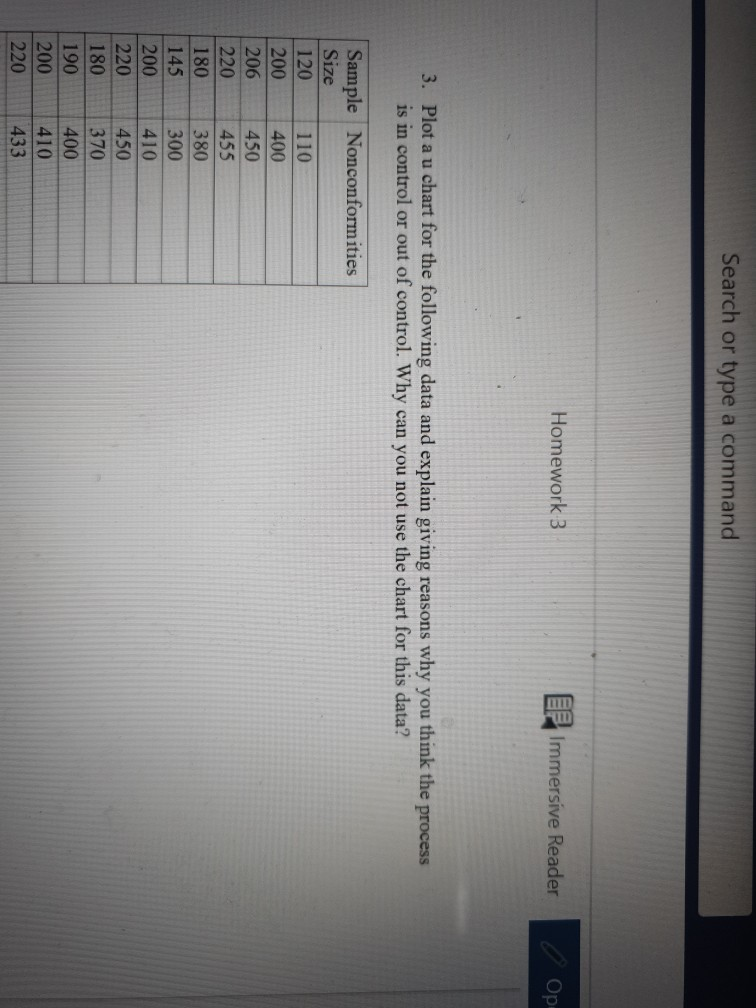
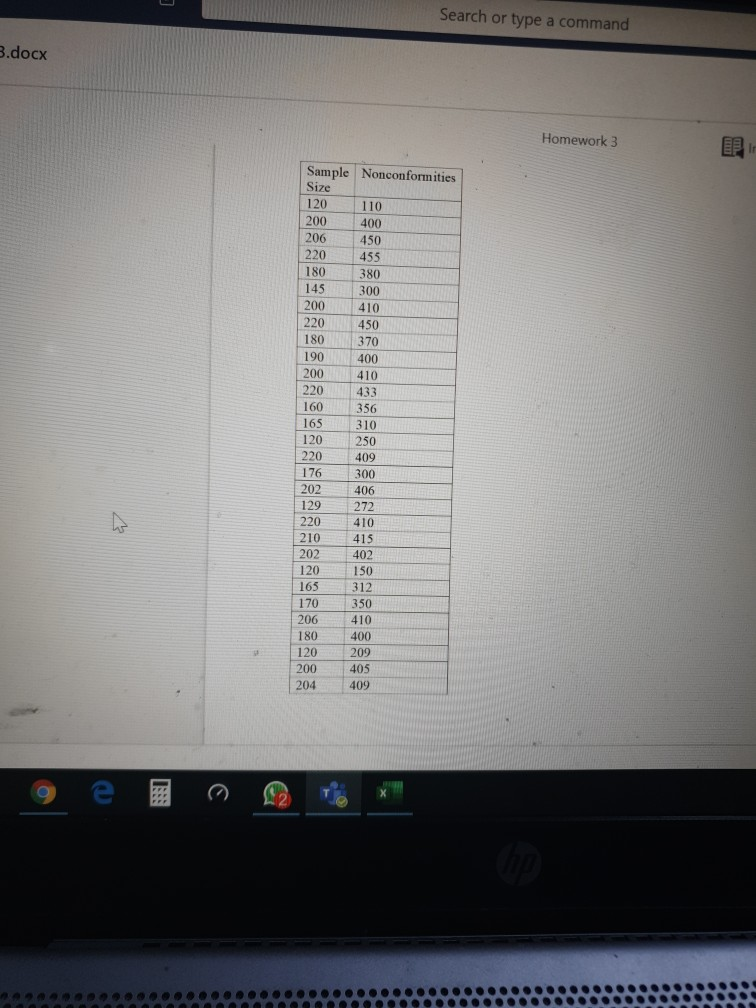
Search or type a command Homework 3 Immersive Reader Op 3. Plot a u chart for the following data and explain giving reasons why you think the process is in control or out of control. Why can you not use the chart for this data? Sample Nonconformities Size 120 110 200 400 206 450 220 455 180 380 145 200 410 220 450 180 370 190 400 200 410 220 433 300 Search or type a command B.docx Homework 3 Sample Nonconformities Size 120 110 200 400 206 450 220 455 180 380 145 300 200 410 220 450 180 370 190 400 200 410 220 433 160 356 165 310 120 250 220 409 176 300 202 406 VE 04 129 272 - 220 410 210 415 202 402 120 150 165 312 170 350 11 DU 206 180 400 120 209 200 405 204 409 no 410 e CStep by Step Solution
There are 3 Steps involved in it
1 Expert Approved Answer
Step: 1 Unlock

Question Has Been Solved by an Expert!
Get step-by-step solutions from verified subject matter experts
Step: 2 Unlock
Step: 3 Unlock