

Question: step by step explanations. 7. Given this scatter graph: 63E! 3 a Sign Legibility Distance (feet) a D B c: isasssasssssrsas DrNerAgetyears) a. Draw an
step by step explanations.
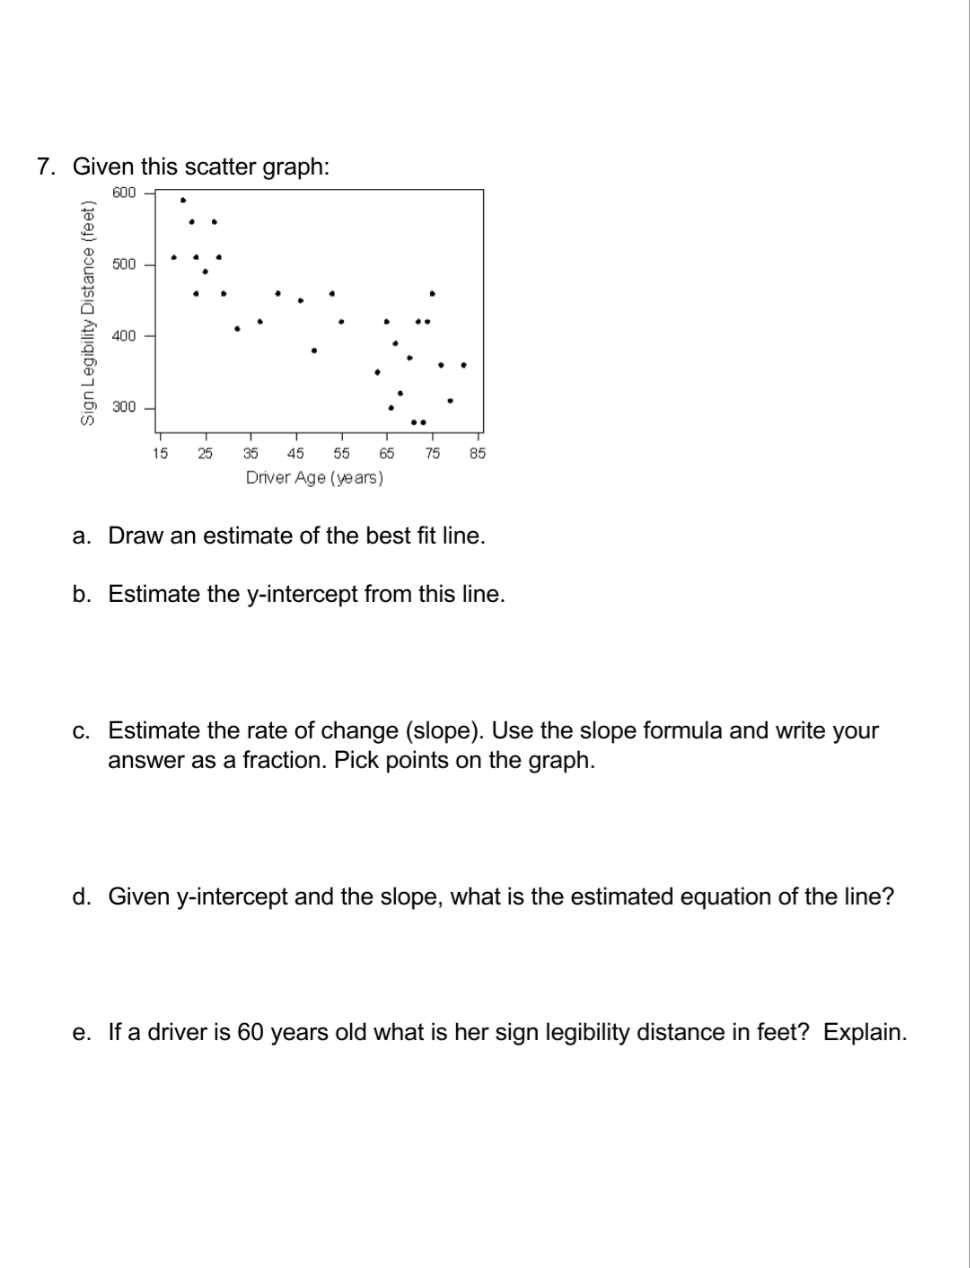
7. Given this scatter graph: 63E! 3 a Sign Legibility Distance (feet) a D B c: isasssasssssrsas DrNerAgetyears) a. Draw an estimate of the best t line. b. Estimate the y-intercept from this line. c. Estimate the rate of change (slope). Use the slope formula and write your answer as a fraction. Pick points on the graph. d. Given y-interoept and the slope, what is the estimated equation of the line? e. If a driver is 60 years old what is her sign legibility distance in feet? Explain
Step by Step Solution
There are 3 Steps involved in it
1 Expert Approved Answer
Step: 1 Unlock

Question Has Been Solved by an Expert!
Get step-by-step solutions from verified subject matter experts
Step: 2 Unlock
Step: 3 Unlock