

Question: step by step for c please. Problem 4. Data Distribution (20 points) Table 3 shows 2, 100 student grades and their preferences on courses collected
step by step for c please.
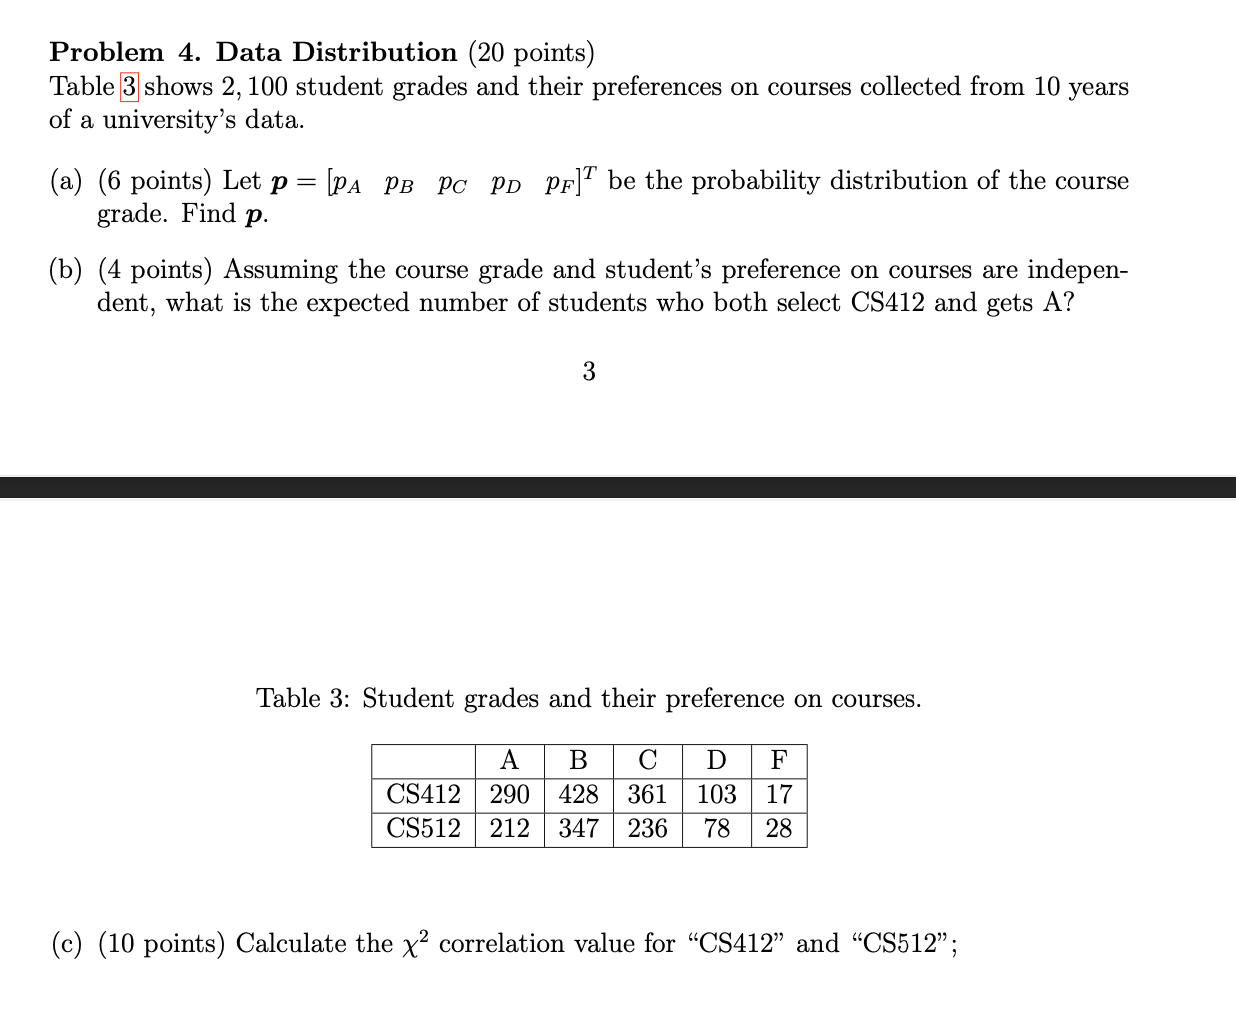
Problem 4. Data Distribution (20 points) Table 3 shows 2, 100 student grades and their preferences on courses collected from 10 years of a university's data. (a) (6 points) Let p=[pApBpCpDpF]T be the probability distribution of the course grade. Find p. (b) (4 points) Assuming the course grade and student's preference on courses are independent, what is the expected number of students who both select CS412 and gets A? 3 Table 3: Student grades and their preference on courses. (c) (10 points) Calculate the 2 correlation value for "CS412" and "CS512
Step by Step Solution
There are 3 Steps involved in it
1 Expert Approved Answer
Step: 1 Unlock

Question Has Been Solved by an Expert!
Get step-by-step solutions from verified subject matter experts
Step: 2 Unlock
Step: 3 Unlock