

Question: step by step only with how to graph on excel Problem 6 FULL SCREEN PRINTER VERSION BLACK The Awake Coffee Company produces gourmet instant coffee.
step by step only with how to graph on excel 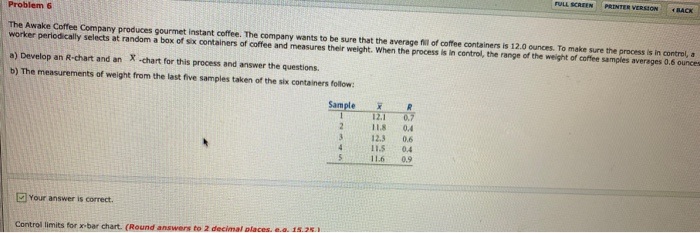
Problem 6 FULL SCREEN PRINTER VERSION BLACK The Awake Coffee Company produces gourmet instant coffee. The company wants to be sure that the average fill of coffee containers is 12.0 ounces. To make sure the process is in control, a worker periodically selects at random a box of six containers of coffee and measures their weight. When the process is in control, the range of the weight of coffee samples averages 0.6 ounces a) Develop an R-chart and an Xchart for this process and answer the questions b) The measurements of weight from the last five samples taken of the six containers follow: Sample 1 2 3 x 12.1 11.8 12.3 11.5 11.6 R 0.7 0.4 0.6 0.4 0.9 4 5 Your answer is correct. Control limits for x-bar chart. (Round answers to 2 decimal places. e.a. 15.25 Step by Step Solution
There are 3 Steps involved in it
1 Expert Approved Answer
Step: 1 Unlock

Question Has Been Solved by an Expert!
Get step-by-step solutions from verified subject matter experts
Step: 2 Unlock
Step: 3 Unlock