

Question: STEP BY STEP PLEASE Demand information for 3 time periods is shown in the table below. Period Demand Period Demand Period Demand 235 1 240
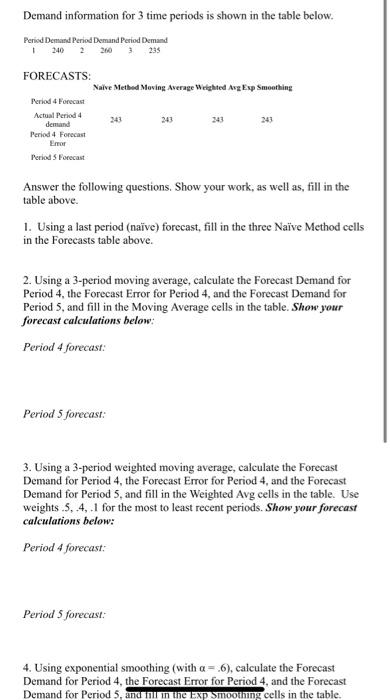
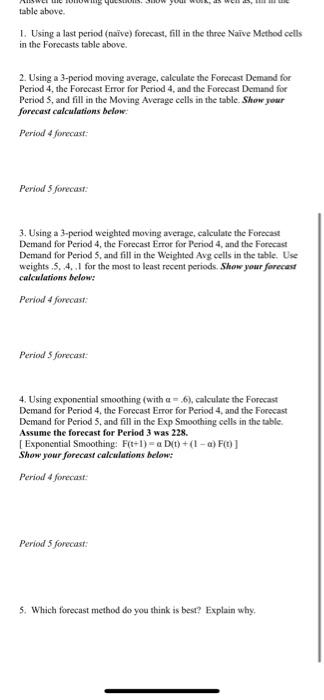
Demand information for 3 time periods is shown in the table below. Period Demand Period Demand Period Demand 235 1 240 2 200 3 FORECASTS: Naive Method Moving Average Weighted Aug Exp Smoothing Period 4 Forecast Actual Period 4 243 demand 243 243 243 Period 4 Forecast Emor Periods Forecast Answer the following questions. Show your work, as well as, fill in the table above. 1. Using a last period (nave) forecast, fill in the three Naive Method cells in the Forecasts table above. 2. Using a 3-period moving average, calculate the Forecast Demand for Period 4, the Forecast Error for Period 4, and the Forecast Demand for Period S, and fill in the Moving Average cells in the table. Show your forecast calculations below: Period 4 forecast: Period 5 forecast: 3. Using a 3-period weighted moving average, calculate the Forecast Demand for Period 4, the Forecast Error for Period 4, and the Forecast Demand for Period 5, and fill in the Weighted Avg cells in the table. Use weights 5..4..1 for the most to least recent periods. Show your forecast calculations below: Period 4 forecast: Period 5 forecast: 4. Using exponential smoothing (with a = 6), calculate the Forecast Demand for Period 4, the Forecast Error for Period 4, and the Forecast Demand for Period 5, and in in the Exp Smooting cells in the table. wowo table above. 1. Using a last period (naive) forecast, fill in the three Naive Method cells in the Forecasts table above. 2. Using a 3-period moving average, calculate the Forecast Demand for Period 4, the Forecast Error for Period 4, and the Forecast Demand for Periods, and fill in the Moving Average cells in the table. Show your forecast calculations below: Period 4 fiecast Period 5 forecast: 3. Using a 3-period weighted moving average calculate the Forecase Demand for Period 4, the Forecast Error for Period 4, and the Forecast Demand for Period 5, and fill in the Weighted Avg cells in the table. Use weights. 5..4..1 for the most to least recent periods. Show your forecast calculations below: Period 4 forecast: Period 5 forecast: 4. Using exponential smoothing (with a = 6), calculate the Forecast Demand for Period 4, the Forecast Error for Period 4, and the Forecast Demand for Period 5, and fill in the Exp Smoothing cells in the table. Assume the forecast for Period 3 was 228. [Exponential Smoothing: F(t+1) = a Dkt) + (1 - u) FO] Show your forecast calculations below: Period 4 forecast: Period 5 forecast 5. Which forecast method do you think is best? Explain why, Demand information for 3 time periods is shown in the table below. Period Demand Period Demand Period Demand 235 1 240 2 200 3 FORECASTS: Naive Method Moving Average Weighted Aug Exp Smoothing Period 4 Forecast Actual Period 4 243 demand 243 243 243 Period 4 Forecast Emor Periods Forecast Answer the following questions. Show your work, as well as, fill in the table above. 1. Using a last period (nave) forecast, fill in the three Naive Method cells in the Forecasts table above. 2. Using a 3-period moving average, calculate the Forecast Demand for Period 4, the Forecast Error for Period 4, and the Forecast Demand for Period S, and fill in the Moving Average cells in the table. Show your forecast calculations below: Period 4 forecast: Period 5 forecast: 3. Using a 3-period weighted moving average, calculate the Forecast Demand for Period 4, the Forecast Error for Period 4, and the Forecast Demand for Period 5, and fill in the Weighted Avg cells in the table. Use weights 5..4..1 for the most to least recent periods. Show your forecast calculations below: Period 4 forecast: Period 5 forecast: 4. Using exponential smoothing (with a = 6), calculate the Forecast Demand for Period 4, the Forecast Error for Period 4, and the Forecast Demand for Period 5, and in in the Exp Smooting cells in the table. wowo table above. 1. Using a last period (naive) forecast, fill in the three Naive Method cells in the Forecasts table above. 2. Using a 3-period moving average, calculate the Forecast Demand for Period 4, the Forecast Error for Period 4, and the Forecast Demand for Periods, and fill in the Moving Average cells in the table. Show your forecast calculations below: Period 4 fiecast Period 5 forecast: 3. Using a 3-period weighted moving average calculate the Forecase Demand for Period 4, the Forecast Error for Period 4, and the Forecast Demand for Period 5, and fill in the Weighted Avg cells in the table. Use weights. 5..4..1 for the most to least recent periods. Show your forecast calculations below: Period 4 forecast: Period 5 forecast: 4. Using exponential smoothing (with a = 6), calculate the Forecast Demand for Period 4, the Forecast Error for Period 4, and the Forecast Demand for Period 5, and fill in the Exp Smoothing cells in the table. Assume the forecast for Period 3 was 228. [Exponential Smoothing: F(t+1) = a Dkt) + (1 - u) FO] Show your forecast calculations below: Period 4 forecast: Period 5 forecast 5. Which forecast method do you think is best? Explain why
Step by Step Solution
There are 3 Steps involved in it

Get step-by-step solutions from verified subject matter experts