

Question: step by step please no excel Question (7.5+7.5 Points) 1. The Marketing Representative of Pearson Publications wanted to order Operations Management books for printing for
step by step please no excel 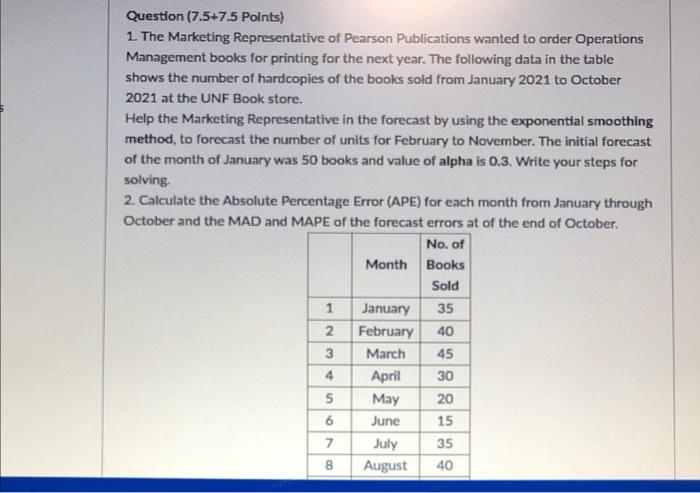
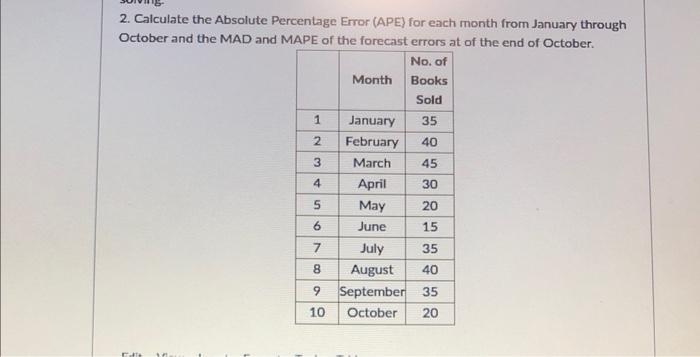
Question (7.5+7.5 Points) 1. The Marketing Representative of Pearson Publications wanted to order Operations Management books for printing for the next year. The following data in the table shows the number of hardcopies of the books sold from January 2021 to October 2021 at the UNF Book store. Help the Marketing Representative in the forecast by using the exponential smoothing method, to forecast the number of units for February to November. The initial forecast of the month of January was 50 books and value of alpha is 0.3. Write your steps for solving 2. Calculate the Absolute Percentage Error (APE) for each month from January through October and the MAD and MAPE of the forecast errors at of the end of October. No. of Month Books Sold 1 January 35 2 February 40 3 March 45 4 April 5 May June 15 July 35 August 40 2 8 A 8 20 6 6 N 8 2. Calculate the Absolute Percentage Error (APE) for each month from January through October and the MAD and MAPE of the forecast errors at of the end of October No. of Month Books Sold 1 1 2 N 3 4 5 5 6 January 35 February 40 March 45 April 30 May 20 June 15 July 35 August 40 September 35 October 20 6 7 8 ON 10
Step by Step Solution
There are 3 Steps involved in it
1 Expert Approved Answer
Step: 1 Unlock

Question Has Been Solved by an Expert!
Get step-by-step solutions from verified subject matter experts
Step: 2 Unlock
Step: 3 Unlock