

Question: step by step SUMMARY OUTPUT Regression Statistics Multiple R D.19 R Square D.04 Adjusted R Square -0.24 Standard Error 10.60 Observations 10 ANOVA SS MS
step by step
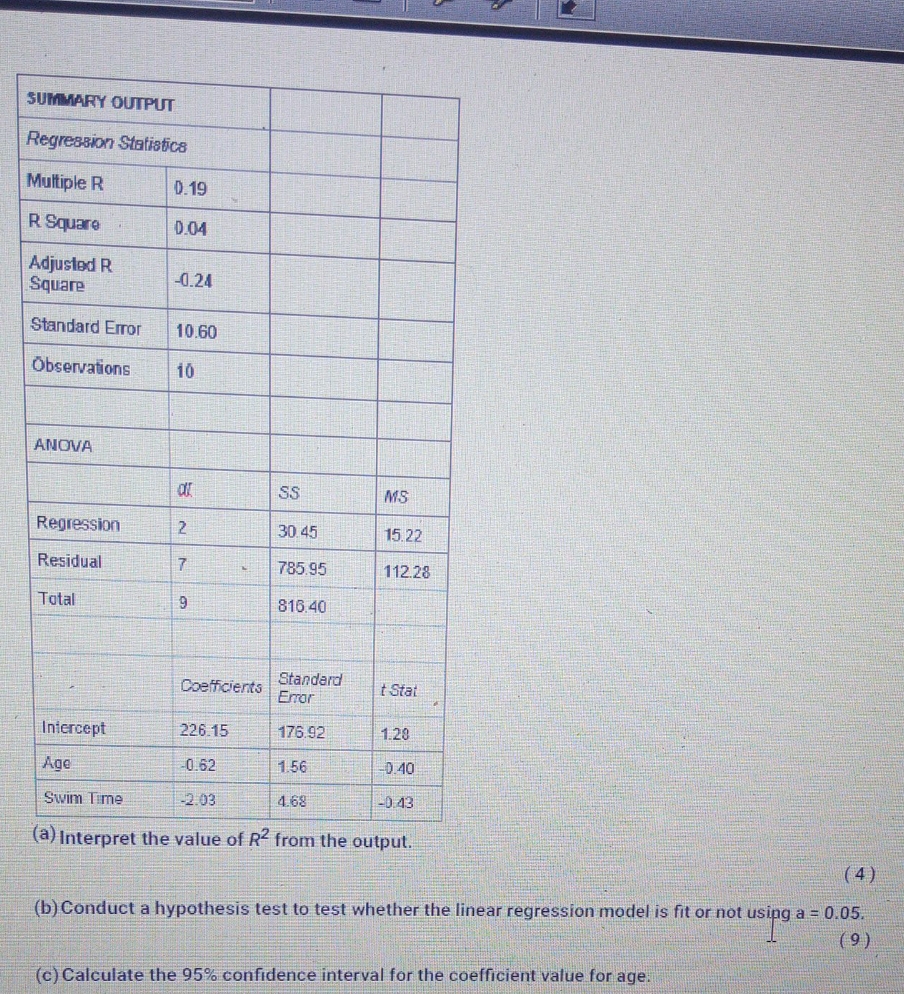
SUMMARY OUTPUT Regression Statistics Multiple R D.19 R Square D.04 Adjusted R Square -0.24 Standard Error 10.60 Observations 10 ANOVA SS MS Regression 2 30 45 15.22 Residual 7 785.95 112.28 Total 9 816.40 Coefficients Standard Error t Stat Intercept 226 15 176.92 1.20 Age 0.62 1.56 D.40 Swim Time -2.03 4.68 -0.43 (a) Interpret the value of R2 from the output. (4) (b) Conduct a hypothesis test to test whether the linear regression model is fit or not using a = 0.05. (9 ) (c) Calculate the 95% confidence interval for the coefficient value for age
Step by Step Solution
There are 3 Steps involved in it
1 Expert Approved Answer
Step: 1 Unlock

Question Has Been Solved by an Expert!
Get step-by-step solutions from verified subject matter experts
Step: 2 Unlock
Step: 3 Unlock