

Question: Step Instructions Points Possible 1 0 Start Excel. Download and open the file named e06c1DirecoWarketing.xlsx. Save it as e06c1DirectMarketing_LastFirst.xlsx. Note: You must save the file

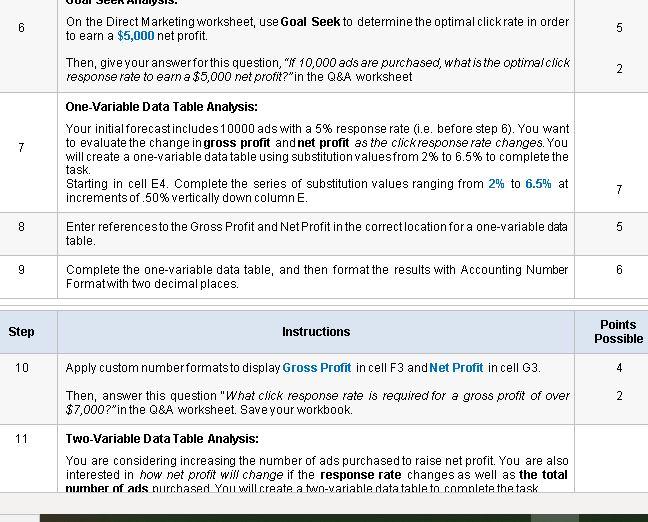


Step Instructions Points Possible 1 0 Start Excel. Download and open the file named e06c1DirecoWarketing.xlsx. Save it as e06c1DirectMarketing_LastFirst.xlsx. Note: You must save the file name correctly. Otherwise, your assignment will be deducted by 5 pts. 2 5 3 3 4 7 On the Direct Marketing worksheet, create appropriate range namesfor Resign Fee (cell B8). Cost.Per Ad (cell B9), Total. Clicks (cell B10), Profit.Per Click (811), and Gross Profit (cell B12). Edit the existing name range Design Eee to Design_Fee2021 to reflect the currentyear. Use the newly created range namesto create a formula to calculate Gross Profit (cell B12) and Net Profit (cell B13). Hints: Gross profit is the product of total clicks and profit per click. Net profit is Gross profit- ad designfee- total clicks * cost per ad design. Create a new worksheet named Range Names, paste the newly created range name information(created in step 2-3) in cell A1, and resize the columns as neededfor proper display. Mac users, use the Insert menu to insert a new worksheet and paste the range names. Goal Seek Analysis: On the Direct Marketing worksheet, use Goal Seek to determine the optimal click rate in order to earn a $5,000 net profit. Then, give your answer for this question, "f 10,000 ads are purchased what is the optimal click response rate to earn a $5,000 net profit?"in the Q&A worksheet 5 6 5 2 One-Variable Data Table Analysis: Your initial forecast includes 10000 ads with a 5% response rate (i.e. before step 6). You want 11 6 5 On the Direct Marketing worksheet, use Goal Seek to determine the optimal click rate in order to earn a $5,000 net profit. Then, give your answer for this question, " 10,000 ads are purchased what is the optimal click response rate to earn a $5,000 net profit?"in the Q&A worksheet 2 7 One-Variable Data Table Analysis: Your initial forecast includes 10000 ads with a 5% response rate (i.e. before step 6). You want to evaluate the change in gross profit and net profit as the click response rate changes. You will create a one-variable datatable using substitution valuesfrom 2% to 6.5% to complete the task. Starting in cell E4. Complete the series of substitution values ranging from 2% to 6.5% at increments of 50% vertically down column E. 7 8 5 Enter referencesto the Gross Profit and Net Profit in the correct location for a one-variable data table. 9 ia Complete the one-variable data table, and then format the results with Accounting Number Format with two decimal places Step Instructions Points Possible 10 Apply custom number formatsto display Gross Profit in cell F3 and Net Profit in cell G3. 4 2 Then, answer this question "What click response rate is required for a gross profit of over $7,000?"in the Q&A worksheet. Save your workbook. 11 TWO-Variable Data Table Analysis: You are considering increasing the number of ads purchased to raise net profit. You are also interested in now net profit will change if the response rate changes as well as the total number of ads nurchased You will create a two-variable data tahle to complete the task 5 12 You are considering increasing the number of ads purchased to raise net profit. You are also interested in how net profit will change if the response rate changes as well as the total number of ads purchased. You will create a two-variable data table to complete the task. Copy the response rate substitution valuesfrom the one-variable data table, and then paste the values starting in cell 14. Type 10000 in cell 43. Complete the series of substitution valuesfrom 10000 to 40000 at 5000 increments. Enter the reference to net profit formula in the correct location for a two-variable data table. Complete the two-variable data table and format the results with Accounting Number Format with two decimal places. 5 13 4 14 7 15 Apply a custom number formatto make the formula reference appear asNet Profit. 4 Now, answer these questions on Q&A worksheet, "For the two-variable data table, if20,000 ads are purchased, what is the required response rate to net$5000?" and "For the two-variable data table, if the ads purchased is raised to 40,000, what is the required response rate to net $10000?". Save your workbook. 16 Scenario Manager Analysis: Up to this point, you have created forecasts based on static amounts; however, it is important to plan for both positive and negative outcomes. To help you analyze best, worst, and most likely outcomes, you will use Scenario Manager. Make the Direct Marketing worksheet active. Create a scenario named Best Case, using Number of Ads and Click Rate. Enter these valuesforthe scenario: 40000, and 6.5%. 6 17 6 Create a second scenario named Worst Case, using the same changing cells. Enter these valuesfor the scenario: 10000, and 1%. 14 Complete the two-variable data table and format the results with Accounting Number Format with two decimal places 15 4 Apply a custom number format to make the formula reference appear asNet Profit. Now, answer these questions on Q&A worksheet, "For the two-variable data table, if 20,000 ads are purchased, what is the required response rate to net$5000?"and "For the two-variable data table, if the ads purchased is raised to 40,000, what is the required response rate to net $10000?". Save your workbook. 16 Scenario Manager Analysis: Up to this point, you have created forecasts based on static amounts; however, it is important to plan for both positive and negative outcomes. To help you analyze best, worst, and most likely outcomes, you will use Scenario Manager. Make the Direct Marketing worksheet active. Create a scenario named Best Case, using Number of Ads and Click Rate. Enter these valuesforthe scenario: 40000, and 6.5%. 6 17 6 Create a second scenario named Worst Case, using the same changing cells. Enter these valuesforthe scenario: 10000, and 1%. Create a third scenario named Most Likely, using the same changing cells. Enter these values for the scenario: 10000, and 6.83%. 18 6 19 4 Generate a scenario summary report using Gross Profit and Net Profit Now, answer the questions, "What is the Net Profit based on the best case scenario?". Create a footer on all worksheets with your name on the left side, the sheet name code in the center, and the file name code on the right side. 20 3 21 Save and close e06c1 DirectWarketing_LastFirst.xlsx. Exit Excel. Submit the file as directed. 0 8 A B D E F G . Direct Marketing Click Rate 2 3 Inputs 4 Number of Ads 10000 5 Click Rate 5.00% 6 7 Parameters 8 Design Fee $ 2,000.00 9 Cost Per Ad $ 2.25 10 Total Clicks 500 11 Profit Per Click $ 12.50 12 Gross Profit 13 Net Profit 14 15 16 17 18 19 20 A B 1 Your Answers 2 3 Question 1) If 10,000 ads are purchased, what is the optimal click response rate to earn a $5,000 net profit? 2) What click response rate is required for a gross profit of over $7,000? 3) For the two-variable data table, if 20,000 ads are purchased, what is the required response rate to net $5000? 4) For the two-variable data table, if the ads purchased is raised to 40,000, what is the required response rate to net $10000? 4 5 6 5) What is the Net Profit based on the best case scenario? 7 8 9 10 11 Step Instructions Points Possible 1 0 Start Excel. Download and open the file named e06c1DirecoWarketing.xlsx. Save it as e06c1DirectMarketing_LastFirst.xlsx. Note: You must save the file name correctly. Otherwise, your assignment will be deducted by 5 pts. 2 5 3 3 4 7 On the Direct Marketing worksheet, create appropriate range namesfor Resign Fee (cell B8). Cost.Per Ad (cell B9), Total. Clicks (cell B10), Profit.Per Click (811), and Gross Profit (cell B12). Edit the existing name range Design Eee to Design_Fee2021 to reflect the currentyear. Use the newly created range namesto create a formula to calculate Gross Profit (cell B12) and Net Profit (cell B13). Hints: Gross profit is the product of total clicks and profit per click. Net profit is Gross profit- ad designfee- total clicks * cost per ad design. Create a new worksheet named Range Names, paste the newly created range name information(created in step 2-3) in cell A1, and resize the columns as neededfor proper display. Mac users, use the Insert menu to insert a new worksheet and paste the range names. Goal Seek Analysis: On the Direct Marketing worksheet, use Goal Seek to determine the optimal click rate in order to earn a $5,000 net profit. Then, give your answer for this question, "f 10,000 ads are purchased what is the optimal click response rate to earn a $5,000 net profit?"in the Q&A worksheet 5 6 5 2 One-Variable Data Table Analysis: Your initial forecast includes 10000 ads with a 5% response rate (i.e. before step 6). You want 11 6 5 On the Direct Marketing worksheet, use Goal Seek to determine the optimal click rate in order to earn a $5,000 net profit. Then, give your answer for this question, " 10,000 ads are purchased what is the optimal click response rate to earn a $5,000 net profit?"in the Q&A worksheet 2 7 One-Variable Data Table Analysis: Your initial forecast includes 10000 ads with a 5% response rate (i.e. before step 6). You want to evaluate the change in gross profit and net profit as the click response rate changes. You will create a one-variable datatable using substitution valuesfrom 2% to 6.5% to complete the task. Starting in cell E4. Complete the series of substitution values ranging from 2% to 6.5% at increments of 50% vertically down column E. 7 8 5 Enter referencesto the Gross Profit and Net Profit in the correct location for a one-variable data table. 9 ia Complete the one-variable data table, and then format the results with Accounting Number Format with two decimal places Step Instructions Points Possible 10 Apply custom number formatsto display Gross Profit in cell F3 and Net Profit in cell G3. 4 2 Then, answer this question "What click response rate is required for a gross profit of over $7,000?"in the Q&A worksheet. Save your workbook. 11 TWO-Variable Data Table Analysis: You are considering increasing the number of ads purchased to raise net profit. You are also interested in now net profit will change if the response rate changes as well as the total number of ads nurchased You will create a two-variable data tahle to complete the task 5 12 You are considering increasing the number of ads purchased to raise net profit. You are also interested in how net profit will change if the response rate changes as well as the total number of ads purchased. You will create a two-variable data table to complete the task. Copy the response rate substitution valuesfrom the one-variable data table, and then paste the values starting in cell 14. Type 10000 in cell 43. Complete the series of substitution valuesfrom 10000 to 40000 at 5000 increments. Enter the reference to net profit formula in the correct location for a two-variable data table. Complete the two-variable data table and format the results with Accounting Number Format with two decimal places. 5 13 4 14 7 15 Apply a custom number formatto make the formula reference appear asNet Profit. 4 Now, answer these questions on Q&A worksheet, "For the two-variable data table, if20,000 ads are purchased, what is the required response rate to net$5000?" and "For the two-variable data table, if the ads purchased is raised to 40,000, what is the required response rate to net $10000?". Save your workbook. 16 Scenario Manager Analysis: Up to this point, you have created forecasts based on static amounts; however, it is important to plan for both positive and negative outcomes. To help you analyze best, worst, and most likely outcomes, you will use Scenario Manager. Make the Direct Marketing worksheet active. Create a scenario named Best Case, using Number of Ads and Click Rate. Enter these valuesforthe scenario: 40000, and 6.5%. 6 17 6 Create a second scenario named Worst Case, using the same changing cells. Enter these valuesfor the scenario: 10000, and 1%. 14 Complete the two-variable data table and format the results with Accounting Number Format with two decimal places 15 4 Apply a custom number format to make the formula reference appear asNet Profit. Now, answer these questions on Q&A worksheet, "For the two-variable data table, if 20,000 ads are purchased, what is the required response rate to net$5000?"and "For the two-variable data table, if the ads purchased is raised to 40,000, what is the required response rate to net $10000?". Save your workbook. 16 Scenario Manager Analysis: Up to this point, you have created forecasts based on static amounts; however, it is important to plan for both positive and negative outcomes. To help you analyze best, worst, and most likely outcomes, you will use Scenario Manager. Make the Direct Marketing worksheet active. Create a scenario named Best Case, using Number of Ads and Click Rate. Enter these valuesforthe scenario: 40000, and 6.5%. 6 17 6 Create a second scenario named Worst Case, using the same changing cells. Enter these valuesforthe scenario: 10000, and 1%. Create a third scenario named Most Likely, using the same changing cells. Enter these values for the scenario: 10000, and 6.83%. 18 6 19 4 Generate a scenario summary report using Gross Profit and Net Profit Now, answer the questions, "What is the Net Profit based on the best case scenario?". Create a footer on all worksheets with your name on the left side, the sheet name code in the center, and the file name code on the right side. 20 3 21 Save and close e06c1 DirectWarketing_LastFirst.xlsx. Exit Excel. Submit the file as directed. 0 8 A B D E F G . Direct Marketing Click Rate 2 3 Inputs 4 Number of Ads 10000 5 Click Rate 5.00% 6 7 Parameters 8 Design Fee $ 2,000.00 9 Cost Per Ad $ 2.25 10 Total Clicks 500 11 Profit Per Click $ 12.50 12 Gross Profit 13 Net Profit 14 15 16 17 18 19 20 A B 1 Your Answers 2 3 Question 1) If 10,000 ads are purchased, what is the optimal click response rate to earn a $5,000 net profit? 2) What click response rate is required for a gross profit of over $7,000? 3) For the two-variable data table, if 20,000 ads are purchased, what is the required response rate to net $5000? 4) For the two-variable data table, if the ads purchased is raised to 40,000, what is the required response rate to net $10000? 4 5 6 5) What is the Net Profit based on the best case scenario? 7 8 9 10 11
Step by Step Solution
There are 3 Steps involved in it

Get step-by-step solutions from verified subject matter experts