

Question: Steps for graphing this in Excel. I DO NOT need anything eith Q or the equation or any math at all whatsoever, simply the steps
Steps for graphing this in Excel. I DO NOT need anything eith Q or the equation or any math at all whatsoever, simply the steps on how to graph all three groups of watershed data a b and c on the same scatter plot graph. That is all.
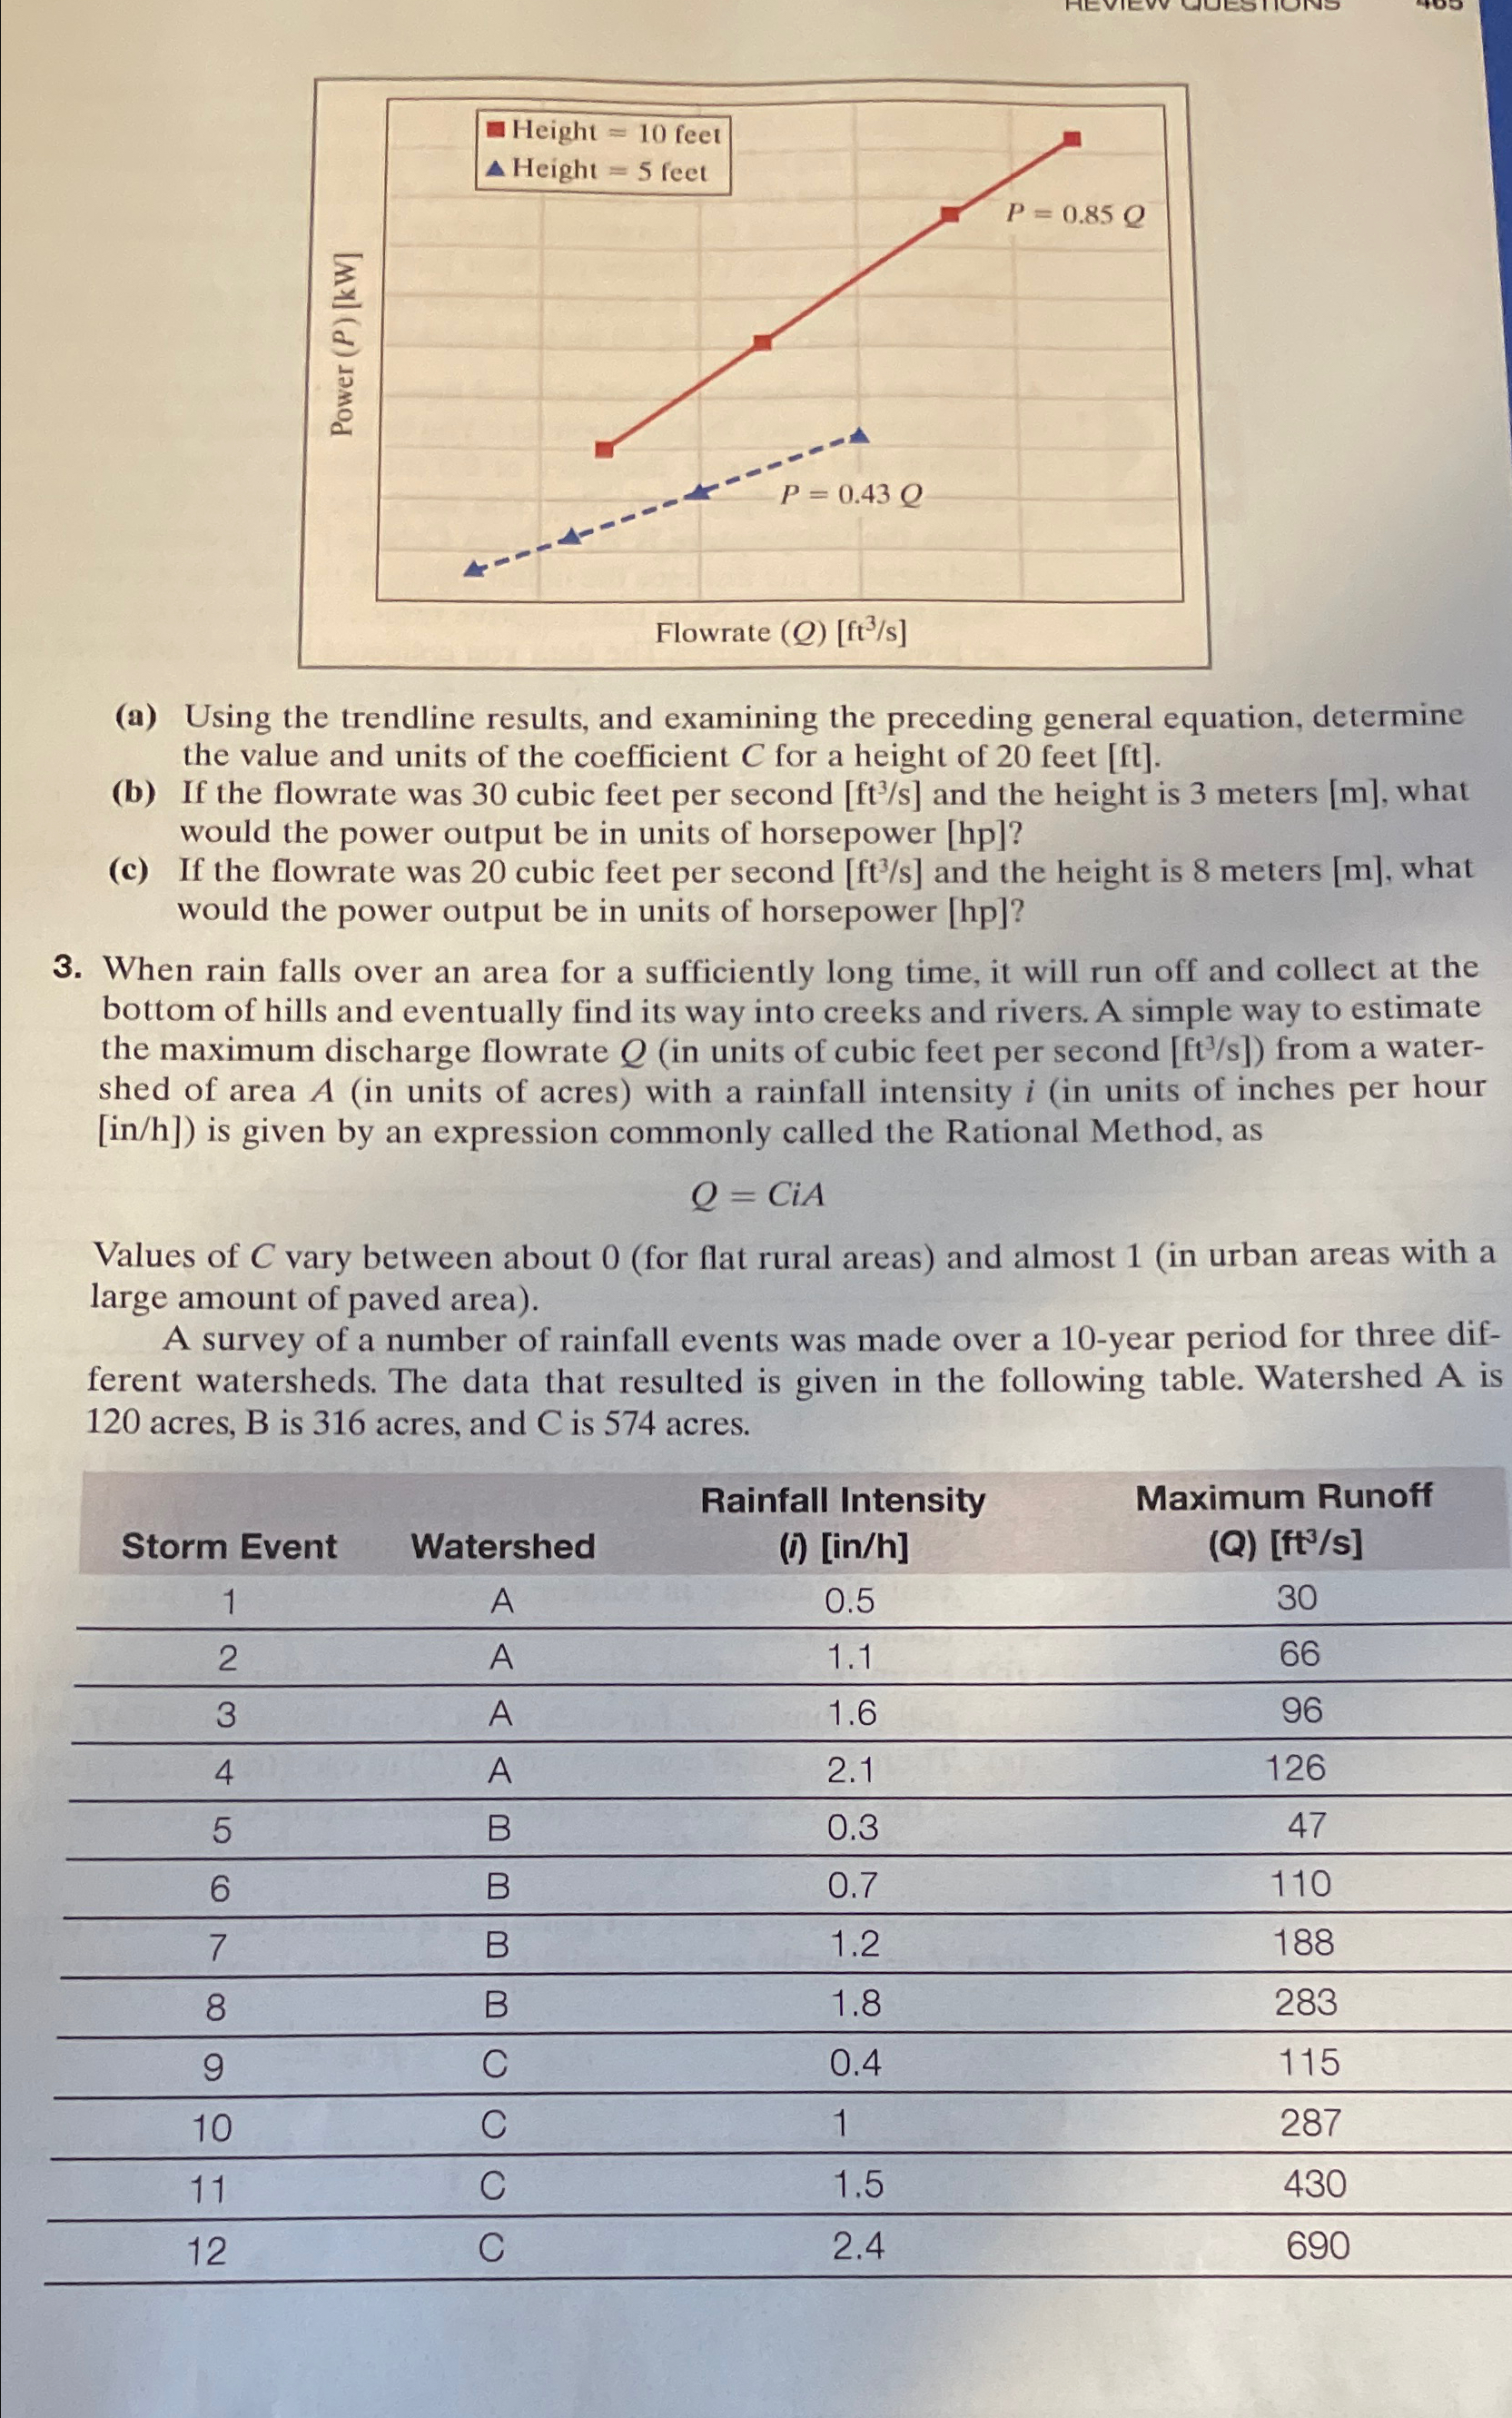
When rain falls over an area for a sufficiently long time, it will run off and collect at the bottom of hills and eventually find its way into creeks and rivers. A simple way to estimate the maximum discharge flowrate in units of cubic feet per second : from a watershed of area in units of acres with a rainfall intensity in units of inches per hour inh is given by an expression commonly called the Rational Method, as
CiA
Values of vary between about for flat rural areas and almost in urban areas with a large amount of paved area
A survey of a number of rainfall events was made over a year period for three different watersheds. The data that resulted is given in the following table. Watershed A is acres, is acres, and is acres.
Create a graph containing all three watersheds, with flowrate on the ordinate, and fit linear trendlines to obtain a simple model for each watershed.
Step by Step Solution
There are 3 Steps involved in it
1 Expert Approved Answer
Step: 1 Unlock

Question Has Been Solved by an Expert!
Get step-by-step solutions from verified subject matter experts
Step: 2 Unlock
Step: 3 Unlock