

Question: Steps: For this assignment, complete the following steps: 1. Complete this worksheet by replacing the bracketed text with the relevant information. Use Table 1 as


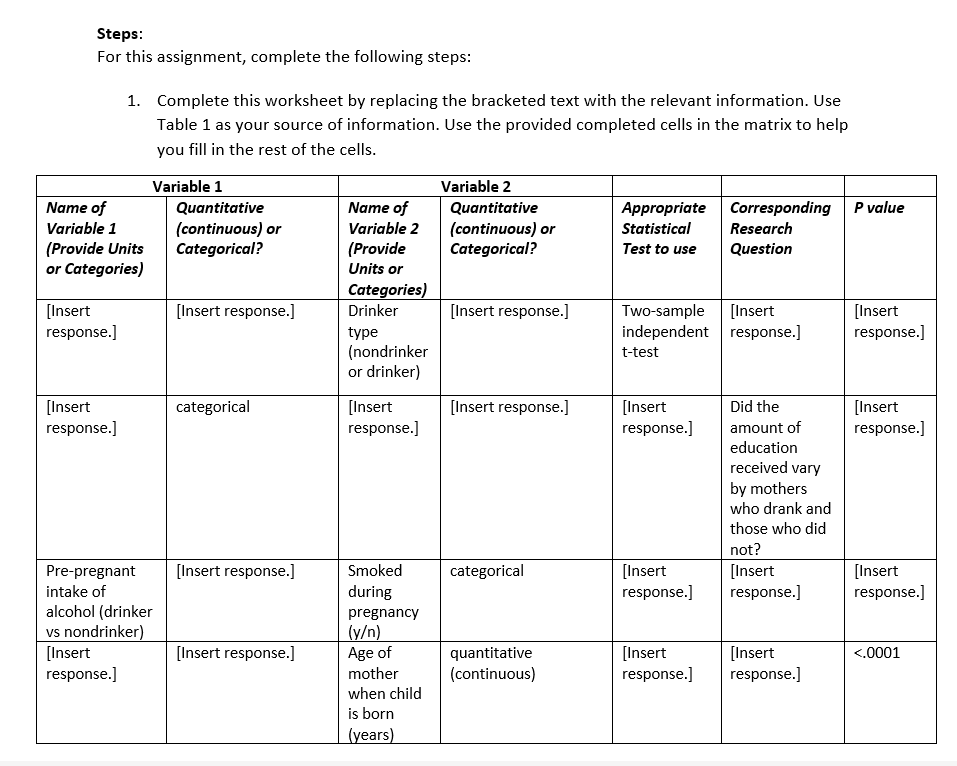
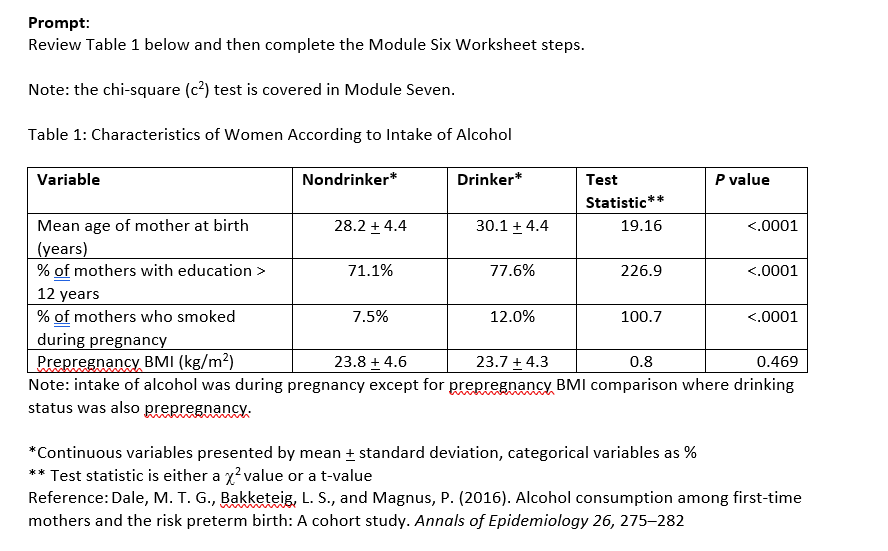
Steps: For this assignment, complete the following steps: 1. Complete this worksheet by replacing the bracketed text with the relevant information. Use Table 1 as your source of information. Use the provided completed cells in the matrix to help you fill in the rest of the cells. Variable 1 Variable 2 Name of Quantitative Name of Quantitative Appropriate Corresponding F ual'ue Variable .1 {continuous} or Variabie 2 {continuous} or Statistical' Research {Provide Units Categorical? {Provide Categorical? Test to use Question or Categories] Units or Categories) [Insert [Insert response] Drinker [Insert response] Twosample [Insert [Insert response] tvpe independent response] response] [nondrinker ttest or drinker} [Insert categorical [Insert [Insert response] [Insert Did the [Insert response] response] response] amount of response] education received vary by mothers who drank and those who did not? Prepregnant [Insert response] Smoked categorical [Insert [Insert [Insert intake of during response] response] response] alcohol [drinker pregnancyI vs nondrinker] [Insert [Insert response] quantitative [Insert [Insert (.0001 response] [continuous] response] response] when child is born Prompt: Review Table 1 below and then complete the Module Six Worksheet steps. Note: the chisquare [(22] test is covered in Module Seven. Table 1: Characteristics of Women According to Intake of Alcohol Variable Mean age of mother at birth (years) 3-6 ozf mothers with education :- 12 years 3-6 o=f mothers who smoked during pregnancy BMI {karma Nondrinker\" 2&2i44 731.1% 15% 213143 Drinker" 3o1i4s 731696 12.0% 21?:43 Test Statistic\" 19.16 226.9 100.]r 0.8 P value {.0001 (.0001 (.0001 0.469 Note: intake of alcohol was during pregnancy except for prepregnancy; BMI comparison where drinking status W35 also EFEEFEEHEHEx. *Continuous variables presented by mean i standard deviation, categorical variables as 5% ** Test statistic is either a 12 value or a tvalue Reference: Dale, M. T. (3., Bakketeigr L. 5., and Magnus, P. {2016). Alcohol consumption among rsttime mothers and the risk preterm birth: A cohort study. Annals of Epidemiology 26, 235282
Step by Step Solution
There are 3 Steps involved in it

Get step-by-step solutions from verified subject matter experts