

Question: Steps in using Excel First, open the Excel spread sheet, click on Data in the tool bar, click on, Data Analysis up on the top
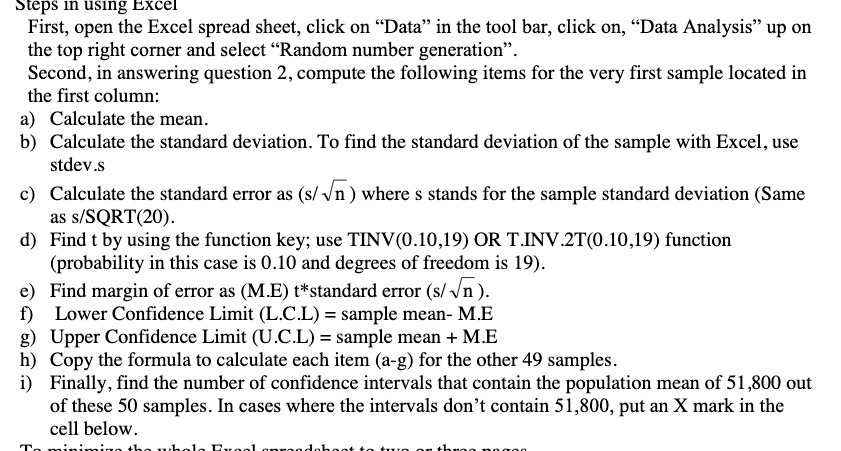

Steps in using Excel First, open the Excel spread sheet, click on "Data" in the tool bar, click on, "Data Analysis" up on the top right corner and select "Random number generation". Second, in answering question 2, compute the following items for the very first sample located in the first column: a) Calculate the mean. b) Calculate the standard deviation. To find the standard deviation of the sample with Excel, use stdev.s c) Calculate the standard error as (s/ vn ) where s stands for the sample standard deviation (Same as s/SQRT(20). d) Find t by using the function key; use TINV(0.10,19) OR T.INV.2T(0.10,19) function (probability in this case is 0.10 and degrees of freedom is 19). e) Find margin of error as (M.E) t*standard error (s/ vn ). f) Lower Confidence Limit (L.C.L) = sample mean- M.E g) Upper Confidence Limit (U.C.L) = sample mean + M.E h) Copy the formula to calculate each item (a-g) for the other 49 samples. i) Finally, find the number of confidence intervals that contain the population mean of 51,800 out of these 50 samples. In cases where the intervals don't contain 51,800, put an X mark in the cell below
Step by Step Solution
There are 3 Steps involved in it

Get step-by-step solutions from verified subject matter experts