

Question: Steps to make this plot in Matlab Details The result of Example 1 5 . 4 . With MATLAB, you can generate other types of
Steps to make this plot in Matlab
Details
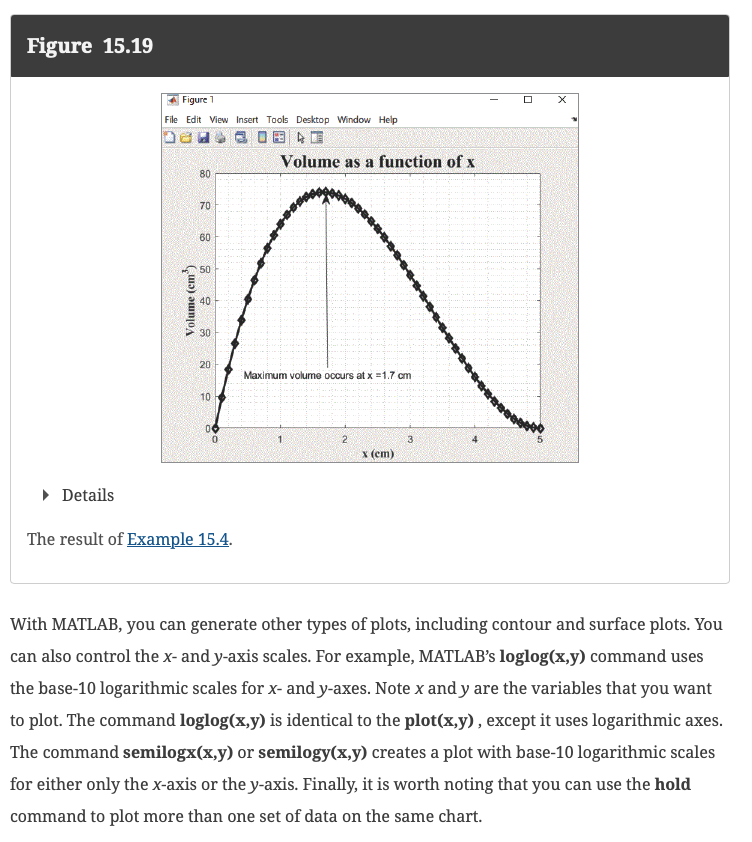
The result of Example
With MATLAB, you can generate other types of plots, including contour and surface plots. You
can also control the x and yaxis scales. For example, MATLAB's loglogxy command uses
the base logarithmic scales for x and yaxes. Note x and y are the variables that you want
to plot. The command loglogxy is identical to the plotxy except it uses logarithmic axes.
The command semilogxxyxy xaxis or the yaxis. Finally, it is worth noting that you can use the hold
command to plot more than one set of data on the same chart.
Step by Step Solution
There are 3 Steps involved in it
1 Expert Approved Answer
Step: 1 Unlock

Question Has Been Solved by an Expert!
Get step-by-step solutions from verified subject matter experts
Step: 2 Unlock
Step: 3 Unlock