

Question: steps to solve and solution A study investigating the effects of blood glucose levels (mmol/L) on blood urea concentration (mmol/L) found a significant correlation between
steps to solve and solution
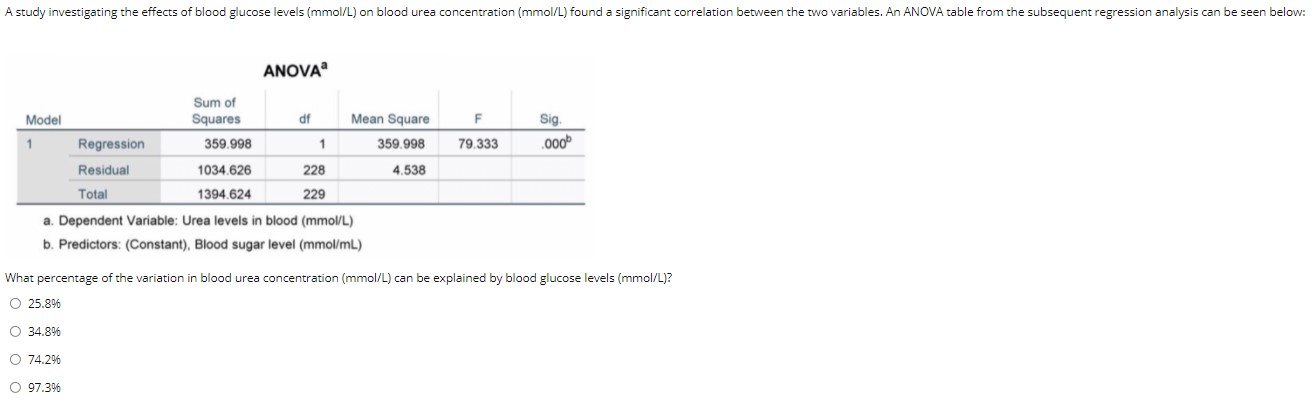
A study investigating the effects of blood glucose levels (mmol/L) on blood urea concentration (mmol/L) found a significant correlation between the two variables. An ANOVA table from the subsequent regression analysis can be seen below: ANOVA Sum of Model Squares df Mean Square F Sig. Regression 359.998 359.998 79.333 000 Residual 1034.626 228 4.538 Total 1394.624 229 a. Dependent Variable: Urea levels in blood (mmol/L) b. Predictors: (Constant), Blood sugar level (mmol/ml) What percentage of the variation in blood urea concentration (mmol/L) can be explained by blood glucose levels (mmol/L)? O 25.896 O 34.89% O 74.296 O 97.3%
Step by Step Solution
There are 3 Steps involved in it

Get step-by-step solutions from verified subject matter experts