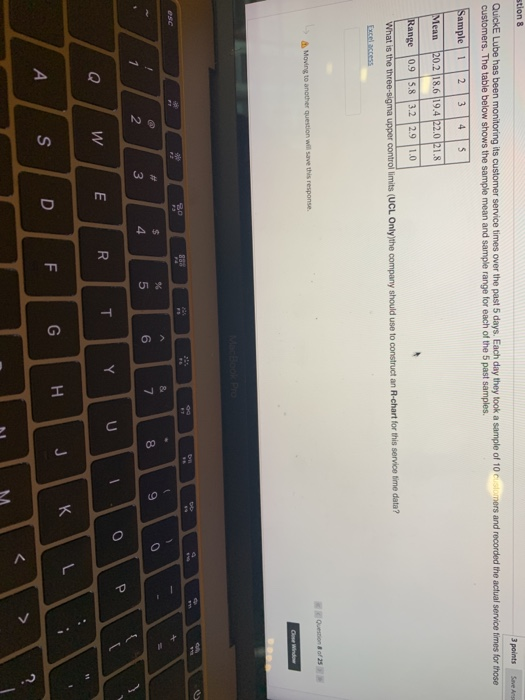
Question: stion 8 3 points Save As Quick E Lube has been monitoring its customer service times over the past 5 days. Each day they took

stion 8 3 points Save As Quick E Lube has been
stion 8 3 points Save As Quick E Lube has been monitoring its customer service times over the past 5 days. Each day they took a sample of 10 customers and recorded the actual service times for those customers. The table below shows the sample mean and sample range for each of the past samples. Sample 1 2 3 4 5 Mean 20.2 18.6 19.4 22.0 21.8 Range 0.9 5.8 3.2 2.9 1.0 What is the three-sigma upper control limits (UCL Only the company should use to construct an R-chart for this service time data? Question of 25 Moving to another question will save this response AsoFo Hulk stion 8 3 points Save As Quick E Lube has been monitoring its customer service times over the past 5 days. Each day they took a sample of 10 customers and recorded the actual service times for those customers. The table below shows the sample mean and sample range for each of the past samples. Sample 1 2 3 4 5 Mean 20.2 18.6 19.4 22.0 21.8 Range 0.9 5.8 3.2 2.9 1.0 What is the three-sigma upper control limits (UCL Only the company should use to construct an R-chart for this service time data? Question of 25 Moving to another question will save this response AsoFo Hulk

Step by Step Solution

There are 3 Steps involved in it

1 Expert Approved Answer
Step: 1 Unlock blur-text-image
Question Has Been Solved by an Expert!

Get step-by-step solutions from verified subject matter experts

Step: 2 Unlock
Step: 3 Unlock

Students Have Also Explored These Related General Management Questions!