

Question: Stock Analysis: In this section, you will select five stocks from the provided list and determine their values by applying an appropriate valuation model from
Stock Analysis:
In this section, you will select five stocks from the provided list and determine their values by applying an appropriate valuation model from the following options: price to multiple model (earning or sales), dividend valuation model, or free cash flow to equity valuation model.
Five selected stocks are as follows:
IBM: Dividends: $6.21 (2018), Earnings: $3.42 per share, $14.77 billion EBITDA 2017, Sales: $79.14 billion (2017), $18.6 billion in Q3 2018
KO: Dividends: $1.56 (2018), Earnings: $0.58 per share, $8.84 billion EBITADA 2017, Sales: $35.02 billion (2017), $8.245 billion in Q3 2018
BAX: Dividends: $0.70 (2018), Earnings: $0.80 per share, $2.24 billion EBITADA 2017, Sales: $10.56 billion (2017), $2.76 billion in Q3 2018
NFLX: Dividends: N/A, Earnings: $0.89 per share, $7.16 billion EBITADA 2017, Sales: $11.69 billion (2017), $3.99 billion in Q3 2018
GE: Dividends: $0.48 (2018), Earnings: -$2.62 per share, $13.38 billion EDITADA 2017, Sales: $122.09 billion (2017), $29.57 in Q3 2018
Dividends shown are total calculated dividend payments for the calendar year. (EX: GE= $0.14 dividend payment in all four quarters of 2018 = $0.48 total for 2018)
A. Determine the value of each stock by using an appropriate model based on the characteristics provided for each stock; use each model at least once.
B. Provide a rationale for the stock valuation method you chose for each stock.
C. Using the calculated valuation, the current market price, and historical performance, determine the expected return for each stock.
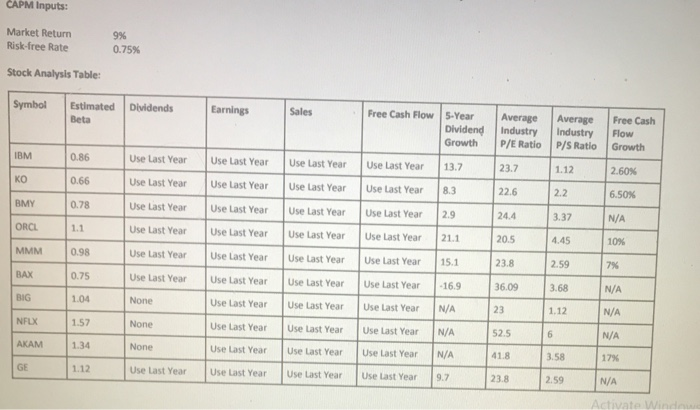
APM Inputs: Market Return Risk-free Rate 9% 0.75% Stock Analysis Table Symbol Estimated Dividends Free Cash Flow 5-Year Average Average Free Cash Earnings Dividend Industry Industry Flow Growth P/E Ratio P/S Ratio Growth Beta Use Last Year Use Last Year Use Last Year Use Last Year 13. Use Last YearUse Last Year Use Last Year Use Last Year 8.3 Use Last YearUse Last Year Use Last Year Use Last Year 2.9 Use Last YearUse Last Year Use Last Year Use Last Year 21.1 Use Last YearUse Last Year Use Last Year Use Last Year 15.1 Use Last YearUse Last Year Use Last Year Use Last Year 169 Use Last Year Use Last Year Use Last Year N/A Use Last Year Use Last Year Use Last Year N/A Use Last Year Use Last Year Use Last Year N/A Use Last Year Use Last Year Use Last Year Use Last Year 9.7 1.12 2.60% 0.66 22.6 6.50% 3.37 4.45 2.59 0.78 24.4 ORCL MMM 0.98 0.75 1.04 N/A 36.09 23 52.5 41.8 23.8 N/A 3.58 17% 1.34 1.12 2.59 APM Inputs: Market Return Risk-free Rate 9% 0.75% Stock Analysis Table Symbol Estimated Dividends Free Cash Flow 5-Year Average Average Free Cash Earnings Dividend Industry Industry Flow Growth P/E Ratio P/S Ratio Growth Beta Use Last Year Use Last Year Use Last Year Use Last Year 13. Use Last YearUse Last Year Use Last Year Use Last Year 8.3 Use Last YearUse Last Year Use Last Year Use Last Year 2.9 Use Last YearUse Last Year Use Last Year Use Last Year 21.1 Use Last YearUse Last Year Use Last Year Use Last Year 15.1 Use Last YearUse Last Year Use Last Year Use Last Year 169 Use Last Year Use Last Year Use Last Year N/A Use Last Year Use Last Year Use Last Year N/A Use Last Year Use Last Year Use Last Year N/A Use Last Year Use Last Year Use Last Year Use Last Year 9.7 1.12 2.60% 0.66 22.6 6.50% 3.37 4.45 2.59 0.78 24.4 ORCL MMM 0.98 0.75 1.04 N/A 36.09 23 52.5 41.8 23.8 N/A 3.58 17% 1.34 1.12 2.59
Step by Step Solution
There are 3 Steps involved in it

Get step-by-step solutions from verified subject matter experts