

Question: Stock Valuation Using Multiples: From the selected company's main page, select the Company details tab and then choose Earings estimates On the left-hand side of
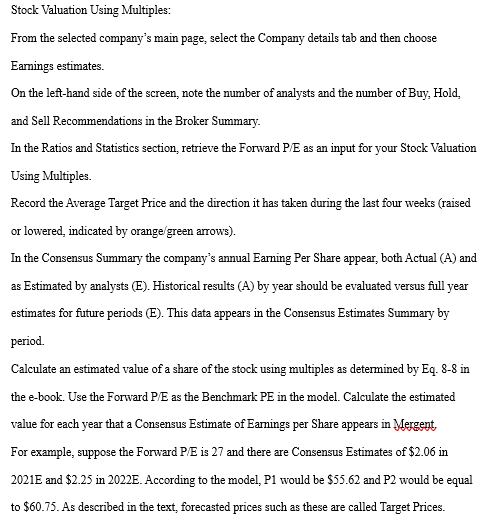
Stock Valuation Using Multiples: From the selected company's main page, select the Company details tab and then choose Earings estimates On the left-hand side of the screen, note the number of analysts and the number of Buy, Hold, and Sell Recommendations in the Broker Summary. In the Ratios and Statistics section, retrieve the Forward P/E as an input for your Stock Valuation Using Multiples. Record the Average Target Price and the direction it has taken during the last four weeks (raised or lowered, indicated by orange green arrows). In the Consensus Summary the company's annual Earning Per Share appear, both Actual (A) and as Estimated by analysts (E). Historical results (A) by year should be evaluated versus full year estimates for future periods (E). This data appears in the Consensus Estimates Summary by period. Calculate an estimated value of a share of the stock using multiples as determined by Eq. 8-8 in the e-book. Use the Forward P/E as the Benchmark PE in the model. Calculate the estimated value for each year that a Consensus Estimate of Eamings per Share appears in Mergent, For example, suppose the Forward PE is 27 and there are Consensus Estimates of $2.06 in 2021E and $2.25 in 2022E. According to the model, P1 would be $55.62 and P2 would be equal to $60.75. As described in the text, forecasted prices such as these are called Target Prices. Incorporated: August 1882, NJ, United States IRS Number: 135409005 CUSIP: 30231G10 Auditor: PricewaterhouseCoopers LLP Legal Counsel: C.W. Matthews Transfer Agent: ComputerShare, College Station, TX Country: United States Industry: Integrated Oil and Gas (ICB 60101000) Industry: Crude petroleum and natural gas (SIC 1311) Industry: Petroleum Refineries (NAICS 324110) Number of Employees: 63,000 (Year End Average Staff as of 12/31/2021) Number of Shareholders: 325,508 (registered) (as of 01/31/2022) Market Cap: 326,917,974,240 Revenue: 285,640,000,000 Net Income: 23,040,000,000 Dividend: 3.5 Dividend Yield: 4.5325 EPS Basic: 5.39 EPS Diluted: 5.39 PE Ratio: 14.3265 Company details Executives Ownership Company financials Equity pricing Annual reports Filings News Competitors Report builder Supply chain Company reports Synopsis Highlights History Business Property Subsidiaries Long term debt Capital stock Earnings estimates Business segments x Download A Printer Friendly My Mergent Tools + 24 7.41 Broker Summary Number of Analysts Number of Buy Recommendations Number of Hold Recommendations Number of Sell Recommendations 6 7.2- 9 EPS Median 7.0- 0 6.8 Ratios and Statistics 2022e 2023 Fiscal Year 12.54 EPS Long-Term Growth Forward P/E 10.61 PEG 0.85 Average Target Price $87.09 Price Target Raised in the Past 4 Wks - 1701 17 Price Target Lowered in the Past 4 Wks - 0 Consensus Estimates (Summary/Detailed) 2019A 2020A 2021A Q12022E Q22022E Q32022E Q42022E 2022E 2023E 2024E 2.24 5.38 2.10 1.94 1.94 1.79 7.35 7.01 6.47 Earnings Per Share Revenue EBITDA 264,938.00 84,709.00 85,049.00 84,315.00 285,640.00 51,814.00 81,311.00 16,650.21 332,638.00 66,230.65 330,929.00 61,023.00 303,168.37 55,583.00 16,376.50 16,025.13 15, 168.41 Stock Valuation Using Multiples: From the selected company's main page, select the Company details tab and then choose Earings estimates On the left-hand side of the screen, note the number of analysts and the number of Buy, Hold, and Sell Recommendations in the Broker Summary. In the Ratios and Statistics section, retrieve the Forward P/E as an input for your Stock Valuation Using Multiples. Record the Average Target Price and the direction it has taken during the last four weeks (raised or lowered, indicated by orange green arrows). In the Consensus Summary the company's annual Earning Per Share appear, both Actual (A) and as Estimated by analysts (E). Historical results (A) by year should be evaluated versus full year estimates for future periods (E). This data appears in the Consensus Estimates Summary by period. Calculate an estimated value of a share of the stock using multiples as determined by Eq. 8-8 in the e-book. Use the Forward P/E as the Benchmark PE in the model. Calculate the estimated value for each year that a Consensus Estimate of Eamings per Share appears in Mergent, For example, suppose the Forward PE is 27 and there are Consensus Estimates of $2.06 in 2021E and $2.25 in 2022E. According to the model, P1 would be $55.62 and P2 would be equal to $60.75. As described in the text, forecasted prices such as these are called Target Prices. Incorporated: August 1882, NJ, United States IRS Number: 135409005 CUSIP: 30231G10 Auditor: PricewaterhouseCoopers LLP Legal Counsel: C.W. Matthews Transfer Agent: ComputerShare, College Station, TX Country: United States Industry: Integrated Oil and Gas (ICB 60101000) Industry: Crude petroleum and natural gas (SIC 1311) Industry: Petroleum Refineries (NAICS 324110) Number of Employees: 63,000 (Year End Average Staff as of 12/31/2021) Number of Shareholders: 325,508 (registered) (as of 01/31/2022) Market Cap: 326,917,974,240 Revenue: 285,640,000,000 Net Income: 23,040,000,000 Dividend: 3.5 Dividend Yield: 4.5325 EPS Basic: 5.39 EPS Diluted: 5.39 PE Ratio: 14.3265 Company details Executives Ownership Company financials Equity pricing Annual reports Filings News Competitors Report builder Supply chain Company reports Synopsis Highlights History Business Property Subsidiaries Long term debt Capital stock Earnings estimates Business segments x Download A Printer Friendly My Mergent Tools + 24 7.41 Broker Summary Number of Analysts Number of Buy Recommendations Number of Hold Recommendations Number of Sell Recommendations 6 7.2- 9 EPS Median 7.0- 0 6.8 Ratios and Statistics 2022e 2023 Fiscal Year 12.54 EPS Long-Term Growth Forward P/E 10.61 PEG 0.85 Average Target Price $87.09 Price Target Raised in the Past 4 Wks - 1701 17 Price Target Lowered in the Past 4 Wks - 0 Consensus Estimates (Summary/Detailed) 2019A 2020A 2021A Q12022E Q22022E Q32022E Q42022E 2022E 2023E 2024E 2.24 5.38 2.10 1.94 1.94 1.79 7.35 7.01 6.47 Earnings Per Share Revenue EBITDA 264,938.00 84,709.00 85,049.00 84,315.00 285,640.00 51,814.00 81,311.00 16,650.21 332,638.00 66,230.65 330,929.00 61,023.00 303,168.37 55,583.00 16,376.50 16,025.13 15, 168.41
Step by Step Solution
There are 3 Steps involved in it

Get step-by-step solutions from verified subject matter experts