

Question: Strategic Planning: performance analysis & strategy implementation Required: 1) Do you agree with FE Consultant's claim that they have strengthened the company and are due
Strategic Planning: performance analysis & strategy implementation
Required: 1) Do you agree with FE Consultant's claim that they have strengthened the company and are due their performance related bonus? 2) Set out your own analysis of the company's competitive position and suggest a strategy.
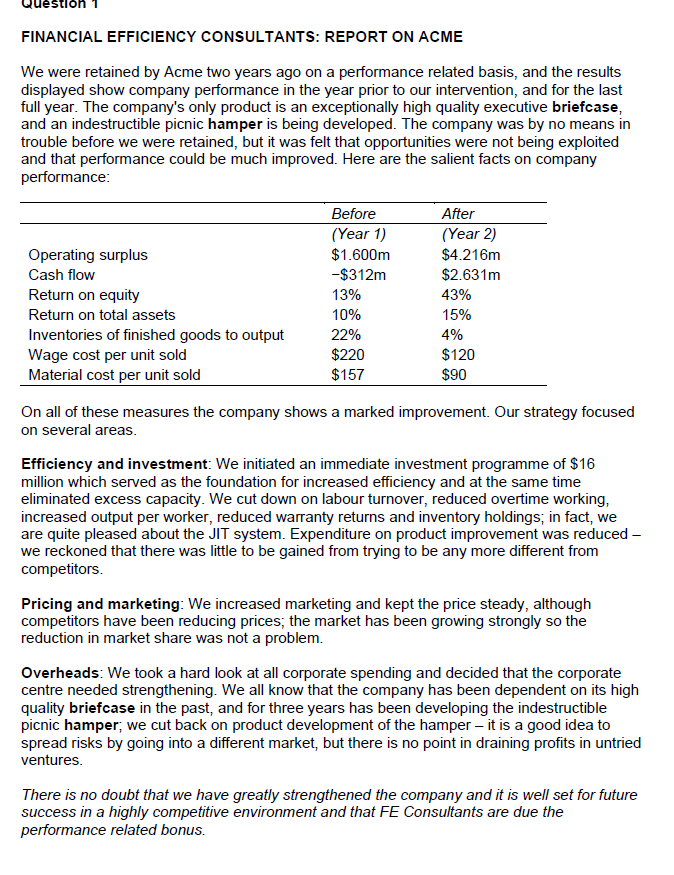
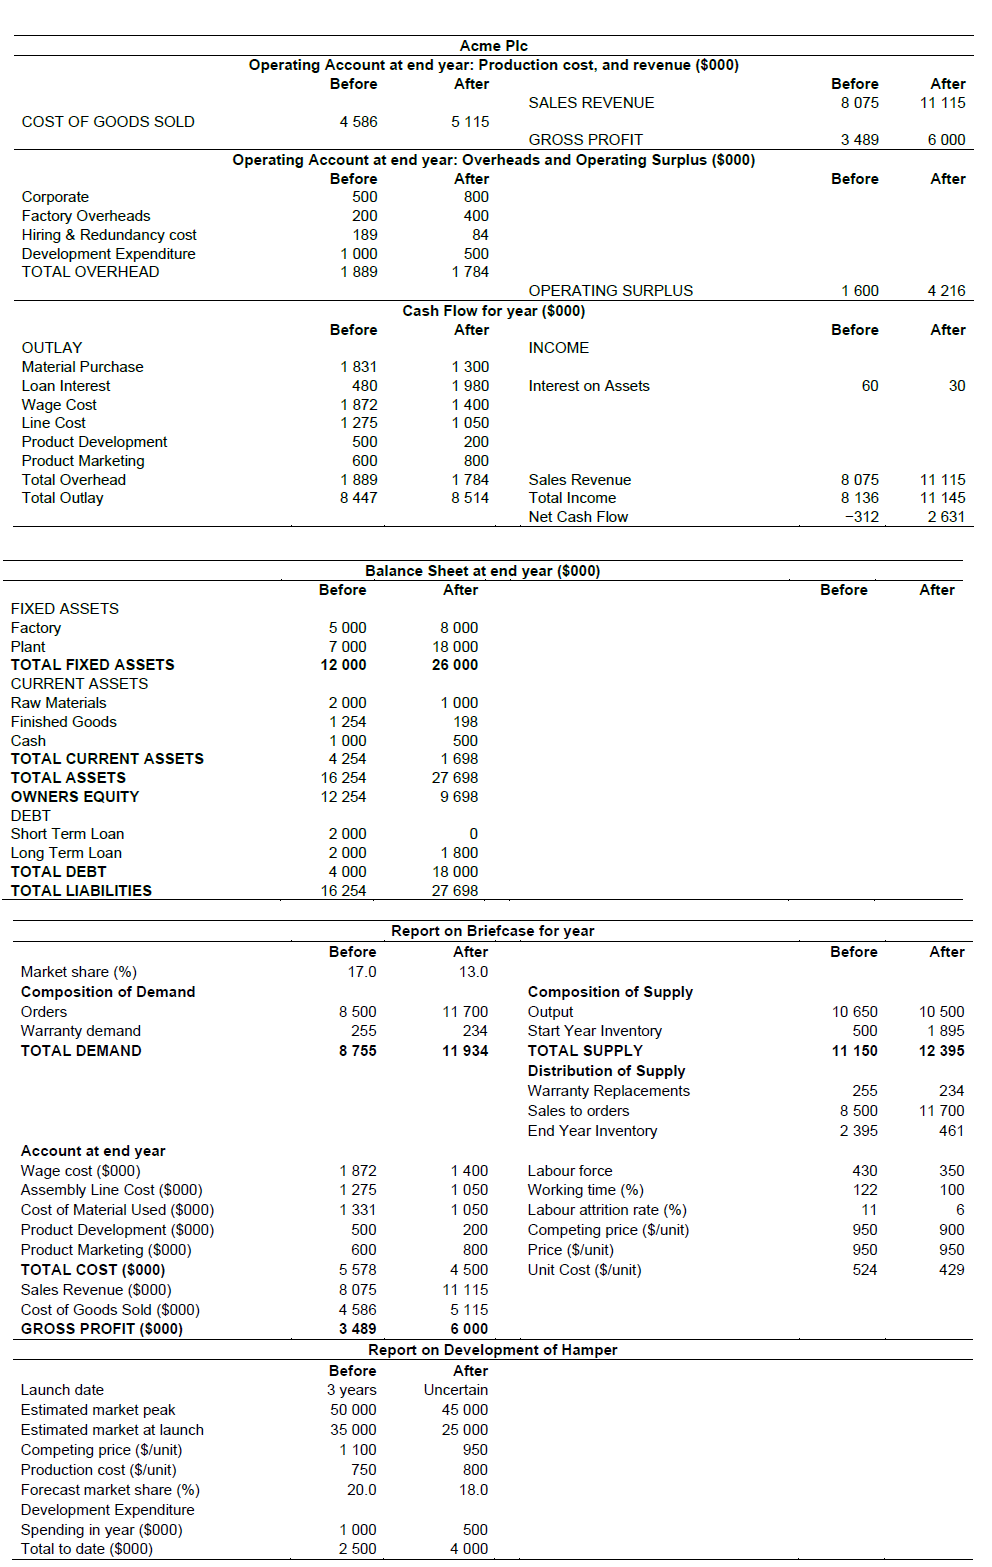
Question FINANCIAL EFFICIENCY CONSULTANTS: REPORT ON ACME We were retained by Acme two years ago on a performance related basis, and the results displayed show company performance in the year prior to our intervention, and for the last full year. The company's only product is an exceptionally high quality executive briefcase, and an indestructible picnic hamper is being developed. The company was by no means in trouble before we were retained, but it was felt that opportunities were not being exploited and that performance could be much improved. Here are the salient facts on company performance: Before After (Year 1) (Year 2) Operating surplus $1.600m $4.216m Cash flow -$312m $2.631m Return on equity 13% 43% Return on total assets 10% 15% 22% 4% Inventories of finished goods to output Wage cost per unit sold $220 $120 Material cost per unit sold $157 $90 On all of these measures the company shows a marked improvement. Our strategy focused on several areas. Efficiency and investment: We initiated an immediate investment programme of $16 million which served as the foundation for increased efficiency and at the same time eliminated excess capacity. We cut down on labour turnover, reduced overtime working, increased output per worker, reduced warranty returns and inventory holdings; in fact, we are quite pleased about the JIT system. Expenditure on product improvement was reduced - we reckoned that there was little to be gained from trying to be any more different from competitors. Pricing and marketing: We increased marketing and kept the price steady, although competitors have been reducing prices; the market has been growing strongly so the reduction in market share was not a problem. Overheads: We took a hard look at all corporate spending and decided that the corporate centre needed strengthening. We all know that the company has been dependent on its high quality briefcase in the past, and for three years has been developing the indestructible picnic hamper; we cut back on product development of the hamper - it is a good idea to spread risks by going into a different market, but there is no point in draining profits in untried ventures. There is no doubt that we have greatly strengthened the company and it is well set for future success in a highly competitive environment and that FE Consultants are due the performance related bonus. COST OF GOODS SOLD Corporate Factory Overheads Hiring & Redundancy cost Development Expenditure TOTAL OVERHEAD OUTLAY Material Purchase Loan Interest Wage Cost Line Cost Product Development Product Marketing Total Overhead Total Outlay FIXED ASSETS Factory Plant TOTAL FIXED ASSETS CURRENT ASSETS Raw Materials Finished Goods Cash TOTAL CURRENT ASSETS TOTAL ASSETS OWNERS EQUITY DEBT Short Term Loan Long Term Loan TOTAL DEBT TOTAL LIABILITIES Market share (%) Composition of Demand Orders Warranty demand TOTAL DEMAND Account at end year Wage cost ($000) Assembly Line Cost ($000) Cost of Material Used ($000) Product Development ($000) Product Marketing ($000) TOTAL COST ($000) Sales Revenue ($000) Cost of Goods Sold ($000) GROSS PROFIT ($000) Launch date Estimated market peak Estimated market at launch Competing price ($/unit) Production cost ($/unit) Forecast market share (%) Development Expenditure Spending in year ($000) Total to date ($000) Acme Plc Operating Account at end year: Production cost, and revenue ($000) Before After SALES REVENUE 4 586 5 115 GROSS PROFIT Operating Account at end year: Overheads and Operating Surplus ($000) Before After 500 800 200 400 189 84 1 000 500 1 889 1 784 OPERATING SURPLUS Cash Flow for year ($000) After Before INCOME 1 831 1 300 480 1 980 Interest on Assets 1872 1 400 1 275 1 050 500 200 600 800 1 889 1 784 Sales Revenue 8 447 8 514 Total Income Net Cash Flow Balance Sheet at end year ($000) After 8 000 18 000 26 000 1 000 198 500 1 698 27 698 9 698 0 1 800 18 000 27 698 Report on Briefcase for year After 13.0 Composition of Supply Output 11 700 234 11 934 Start Year Inventory TOTAL SUPPLY Distribution of Supply Warranty Replacements Sales to orders End Year Inventory 1 400 Labour force 1 050 Working time (%) 1 050 Labour attrition rate (%) Competing price ($/unit) 200 800 Price ($/unit) 4 500 Unit Cost ($/unit) 11 115 5 115 6 000 Report on Development of Hamper After Uncertain 45 000 25 000 950 800 18.0 500 4 000 Before 5 000 7 000 12 000 2 000 1 254 1 000 4 254 16 254 12 254 2 000 2 000 4 000 16 254 Before 17.0 8 500 255 8 755 1 872 1 275 1 331 500 600 5 578 8 075 4 586 3 489 Before 3 years 50 000 35 000 1 100 750 20.0 1 000 2 500 Before 8 075 3 489 Before 1 600 Before 60 8 075 8 136 -312 Before Before 10 650 500 11 150 255 8 500 2 395 430 122 11 950 950 524 After 11 115 6 000 After 4 216 After 30 11 115 11 145 2 631 After After 10 500 1 895 12 395 234 11 700 461 350 100 6 900 950 429
Step by Step Solution
There are 3 Steps involved in it

Get step-by-step solutions from verified subject matter experts