

Question: Struggling with the attached task, please assist Create a python file called theory.py. You have learnt about when and how Logistic Regression is applicable. Using
Struggling with the attached task, please assist
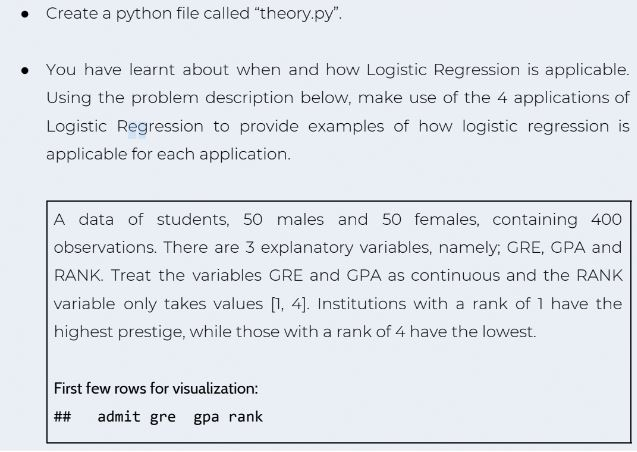
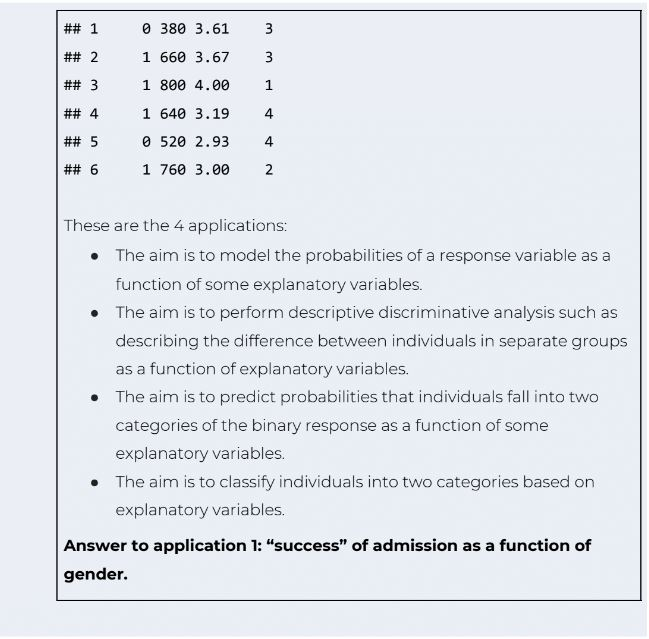
Create a python file called "theory.py". You have learnt about when and how Logistic Regression is applicable. Using the problem description below, make use of the 4 applications of Logistic Regression to provide examples of how logistic regression is applicable for each application. A data of students, 50 males and 50 females, containing 400 observations. There are 3 explanatory variables, namely; GRE, GPA and RANK. Treat the variables GRE and GPA as continuous and the RANK variable only takes values [1, 4). Institutions with a rank of 1 have the highest prestige, while those with a rank of 4 have the lowest. First few rows for visualization: ## admit gre gpa rank # ## 1 ## 2 3 3 # # w 0 380 3.61 1 660 3.67 1 800 4.00 1 640 3.19 0 520 2.934 1 760 3.00 # # ## 5 ## 6 # 2 These are the 4 applications: The aim is to model the probabilities of a response variable as a function of some explanatory variables. The aim is to perform descriptive discriminative analysis such as describing the difference between individuals in separate groups as a function of explanatory variables. The aim is to predict probabilities that individuals fall into two categories of the binary response as a function of some explanatory variables. The aim is to classify individuals into two categories based on explanatory variables. Answer to application 1: "success" of admission as a function of gender. Create a python file called "theory.py". You have learnt about when and how Logistic Regression is applicable. Using the problem description below, make use of the 4 applications of Logistic Regression to provide examples of how logistic regression is applicable for each application. A data of students, 50 males and 50 females, containing 400 observations. There are 3 explanatory variables, namely; GRE, GPA and RANK. Treat the variables GRE and GPA as continuous and the RANK variable only takes values [1, 4). Institutions with a rank of 1 have the highest prestige, while those with a rank of 4 have the lowest. First few rows for visualization: ## admit gre gpa rank # ## 1 ## 2 3 3 # # w 0 380 3.61 1 660 3.67 1 800 4.00 1 640 3.19 0 520 2.934 1 760 3.00 # # ## 5 ## 6 # 2 These are the 4 applications: The aim is to model the probabilities of a response variable as a function of some explanatory variables. The aim is to perform descriptive discriminative analysis such as describing the difference between individuals in separate groups as a function of explanatory variables. The aim is to predict probabilities that individuals fall into two categories of the binary response as a function of some explanatory variables. The aim is to classify individuals into two categories based on explanatory variables. Answer to application 1: "success" of admission as a function of gender
Step by Step Solution
There are 3 Steps involved in it

Get step-by-step solutions from verified subject matter experts