

Question: Student Name Chapter 2 Problem 14 Suggested Answers a Use the spreadsheet to cakulate as mais of the company's profitability, tumover-control and leverage and liqulity
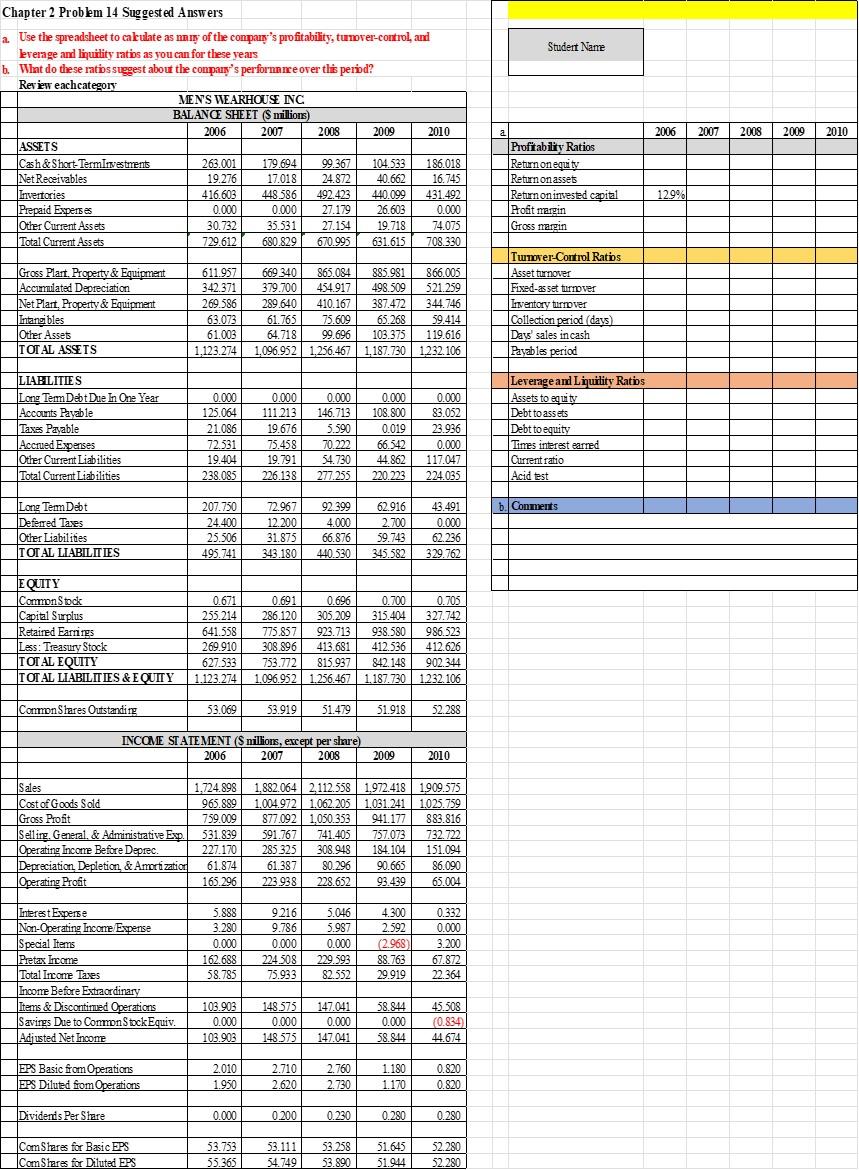
Student Name Chapter 2 Problem 14 Suggested Answers a Use the spreadsheet to cakulate as mais of the company's profitability, tumover-control and leverage and liqulity ratios as you can for these years b. What do these ratis slegest about the company's performance over this perid? Review eachcategory MEN'S WEARHOUSE INC BALANCE SHEET (S millions) 2006 2007 2008 2009 2010 ASSETS Cash & Short-Terminestrents 263.001 179.694 99.367 104.533 186.018 Net Receivables 19.276 17.018 24.872 40.662 16.745 Invertories 416.603 448586 492.423 440.099 431.492 Prepaid Expenses 0.000 0.000 27.179 26.603 0.000 Other Current Assets 30.732 35.531 27.154 19.718 74.075 Total Current Assets 729.612 680.829 670.995 631.615 708.330 2006 2007 2008 2009 2010 a Profitability Ratios Retrnonequity Return on assets Retirnoninvested capital Profit margin Gross nargin 12.9% Gross Plart. Property & Equipment Accumulated Depreciation Net Plart, Property & Equipment Intangibles Other Assets TOT AL ASSETS 611.957 342.371 269.586 63.073 61.003 1.123.274 669 340 865.084 885.981 866.005 379.700 454.917 498.509 521.259 289.640 410.167 387.472 344 746 61.765 75.609 65 268 59.414 64.718 99.696 103.375 119.616 1.096.952 1.256.467 1187.730 1.187.730 1232 106 . Tumover-Control Ratis Asset turnover Fixed-as set turnover Inventory turnover Collection period (days) Days sales in cash Pavables period LIABILITIES Long Tem Debt Due In One Year Accounts Payable Taxes Payable Accrued Expenses Other Current Liabilities Total Current Liabilities 0.000 125.064 21.086 72.531 19.404 238.085 0.000 111 213 19.676 75.458 19.791 226.138 0.000 146.713 5.590 70.222 54.730 277.255 0.000 108.800 0.019 66.542 44.862 220.223 0.000 83.052 23.936 0.000 117.047 224.035 Leverage and Liquility Ratis Assets to equity Debt to assets Debt to equity Times interest earned Current ratio Acid test b. Comments Long Tem Debt Deferred Taxes Other Liabilities TOT AL LIABILITIES 207.750 24.400 25.506 495.741 72.967 12.200 31.875 343.180 92.399 4.000 66.876 440.530 62.916 2.700 59.743 345.582 43.491 0.000 62.236 329.762 E QUITY Common Stick Capital Surplus Retailed Earries Less: Treasury Stock TOTAL EQUITY TOT AL LIABILITIES & EQUITY 0.671 255.214 641.558 269.910 627.533 1.123.274 0.691 0.696 0.700 286.120 305.209 315.404 775.857 923.713 938.580 308.896 413.681 412.536 753.772 815.937 842.148 1.096.952 1.256.467 1.187.730 0.705 327.742 986.523 412.626 902.344 1.232.106 Connon Slares Outstanding 53.069 53.919 51.479 51.918 52.288 INCOME STATEMENT (S millions, except per share) 2006 2007 2008 2009 2010 Sales 1.724.898 Cost of Goods Sold 965.889 Gross Profit 759.009 Selling. General. & Administrative Exp 531 839 Operating Income Before Deprec. 227.170 Depreciation Depletion & Amortization 61.874 Operating Profit 165.296 1,882.064 2,112.558 1,972.418 1.972.418 1909.575 1.004.972 1.062 205 1.031.241 1.025.759 877.092 1,050.353 941.177 883.816 591.767 741 405 757.073 732 722 285 325 308.948 184.104 151.094 61.387 80.296 90.665 86.090 223938 228.652 93.439 65.004 9216 Interest Expense Non-Operating Income Expense Special Items Pretax Income Total Income Taxes Income Before Extraordinary Items & Discontinued Operations Savires Due to Common Stock Equiv. Adjusted Net Income 5.888 3.280 0.000 162.688 58.785 9.786 0.000 224 508 75.933 5.046 5.987 0.000 229 593 82 552 4.300 2.592 (2.968) ( 88.763 29.919 0.332 0.000 3.200 67.872 22.364 103.903 0.000 103.903 148.575 0.000 148.575 147.041 0.000 147.041 58.844 0.000 58.844 45.508 (0.834) 44.674 EPS Basic from Operations EPS Diluted from Operations 2.010 1.950 2.710 2.620 2.760 2.730 1.180 1.170 0.820 0.820 Dividends Per Share 0.000 0 200 0.230 0.280 0.280 Com Shares for Basic EPS Com Shares for Diluted EPS 53.753 55.365 53.111 54.749 53.258 53.890 51.645 51.944 52.280 52.280 Student Name Chapter 2 Problem 14 Suggested Answers a Use the spreadsheet to cakulate as mais of the company's profitability, tumover-control and leverage and liqulity ratios as you can for these years b. What do these ratis slegest about the company's performance over this perid? Review eachcategory MEN'S WEARHOUSE INC BALANCE SHEET (S millions) 2006 2007 2008 2009 2010 ASSETS Cash & Short-Terminestrents 263.001 179.694 99.367 104.533 186.018 Net Receivables 19.276 17.018 24.872 40.662 16.745 Invertories 416.603 448586 492.423 440.099 431.492 Prepaid Expenses 0.000 0.000 27.179 26.603 0.000 Other Current Assets 30.732 35.531 27.154 19.718 74.075 Total Current Assets 729.612 680.829 670.995 631.615 708.330 2006 2007 2008 2009 2010 a Profitability Ratios Retrnonequity Return on assets Retirnoninvested capital Profit margin Gross nargin 12.9% Gross Plart. Property & Equipment Accumulated Depreciation Net Plart, Property & Equipment Intangibles Other Assets TOT AL ASSETS 611.957 342.371 269.586 63.073 61.003 1.123.274 669 340 865.084 885.981 866.005 379.700 454.917 498.509 521.259 289.640 410.167 387.472 344 746 61.765 75.609 65 268 59.414 64.718 99.696 103.375 119.616 1.096.952 1.256.467 1187.730 1.187.730 1232 106 . Tumover-Control Ratis Asset turnover Fixed-as set turnover Inventory turnover Collection period (days) Days sales in cash Pavables period LIABILITIES Long Tem Debt Due In One Year Accounts Payable Taxes Payable Accrued Expenses Other Current Liabilities Total Current Liabilities 0.000 125.064 21.086 72.531 19.404 238.085 0.000 111 213 19.676 75.458 19.791 226.138 0.000 146.713 5.590 70.222 54.730 277.255 0.000 108.800 0.019 66.542 44.862 220.223 0.000 83.052 23.936 0.000 117.047 224.035 Leverage and Liquility Ratis Assets to equity Debt to assets Debt to equity Times interest earned Current ratio Acid test b. Comments Long Tem Debt Deferred Taxes Other Liabilities TOT AL LIABILITIES 207.750 24.400 25.506 495.741 72.967 12.200 31.875 343.180 92.399 4.000 66.876 440.530 62.916 2.700 59.743 345.582 43.491 0.000 62.236 329.762 E QUITY Common Stick Capital Surplus Retailed Earries Less: Treasury Stock TOTAL EQUITY TOT AL LIABILITIES & EQUITY 0.671 255.214 641.558 269.910 627.533 1.123.274 0.691 0.696 0.700 286.120 305.209 315.404 775.857 923.713 938.580 308.896 413.681 412.536 753.772 815.937 842.148 1.096.952 1.256.467 1.187.730 0.705 327.742 986.523 412.626 902.344 1.232.106 Connon Slares Outstanding 53.069 53.919 51.479 51.918 52.288 INCOME STATEMENT (S millions, except per share) 2006 2007 2008 2009 2010 Sales 1.724.898 Cost of Goods Sold 965.889 Gross Profit 759.009 Selling. General. & Administrative Exp 531 839 Operating Income Before Deprec. 227.170 Depreciation Depletion & Amortization 61.874 Operating Profit 165.296 1,882.064 2,112.558 1,972.418 1.972.418 1909.575 1.004.972 1.062 205 1.031.241 1.025.759 877.092 1,050.353 941.177 883.816 591.767 741 405 757.073 732 722 285 325 308.948 184.104 151.094 61.387 80.296 90.665 86.090 223938 228.652 93.439 65.004 9216 Interest Expense Non-Operating Income Expense Special Items Pretax Income Total Income Taxes Income Before Extraordinary Items & Discontinued Operations Savires Due to Common Stock Equiv. Adjusted Net Income 5.888 3.280 0.000 162.688 58.785 9.786 0.000 224 508 75.933 5.046 5.987 0.000 229 593 82 552 4.300 2.592 (2.968) ( 88.763 29.919 0.332 0.000 3.200 67.872 22.364 103.903 0.000 103.903 148.575 0.000 148.575 147.041 0.000 147.041 58.844 0.000 58.844 45.508 (0.834) 44.674 EPS Basic from Operations EPS Diluted from Operations 2.010 1.950 2.710 2.620 2.760 2.730 1.180 1.170 0.820 0.820 Dividends Per Share 0.000 0 200 0.230 0.280 0.280 Com Shares for Basic EPS Com Shares for Diluted EPS 53.753 55.365 53.111 54.749 53.258 53.890 51.645 51.944 52.280 52.280
Step by Step Solution
There are 3 Steps involved in it

Get step-by-step solutions from verified subject matter experts