

Question: Student population size: 96 It has been claimed that the mean height of adults in the U.S. is more than 166 cm. Does the data
Student population size: 96
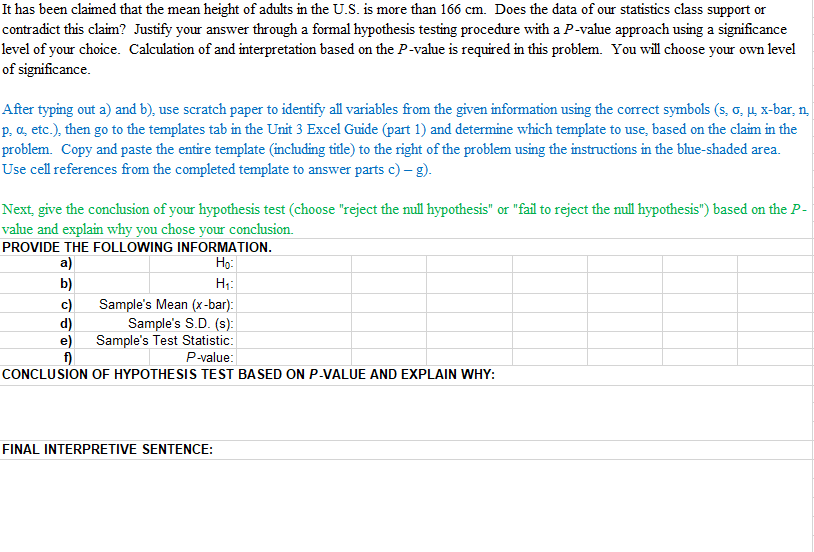
It has been claimed that the mean height of adults in the U.S. is more than 166 cm. Does the data of our statistics class support or contradict this claim? Justify your answer through a formal hypothesis testing procedure with a Pvalue approach using a signicance level of your choice. Calculation of and interpretation based on the Pvalue is required in this problem. You will choose your own level of signicance. After typing out a) and b), use scratch paper to identify all variables from the given information using the correct symbols {55 o, u, xbar, ns p, 0., etc), then go to the templates tab in the Unit 3 Excel Guide (part 1) and determine which template to useb based on the claim in the problem. Copy and paste the entire template (including title) to the right of the problem using the instructions in the theshaded area. Use cell references 'om the completed template to answer parts c) g). Next giye the conclusion of your hypomesis test (choose "reject the null hypothesis" or "fa to reject the null hypodlesis") based on the P - yalue and explain why you chose your conclusion. PROVIDE THE FOLLOWING INFORMATION. 3] Ha: h] H1: c] Sample's Mean {Jr-bar}: d] Sample's SD. is}: e] Sample's Test Statistic: t] P-value: CONCLUSION OF HYPOTHESIS TEST BASED ON PUALUE AND EXPLAIN WHY: FINAL INTERPRETIVE SENTENCE
Step by Step Solution
There are 3 Steps involved in it

Get step-by-step solutions from verified subject matter experts