

Question: Student's Name: Workforce Analytics & Planning Barriers Data must be integrated from multiple sources Lack of automation / repeatable process Metrics need to be identified
Student's Name:
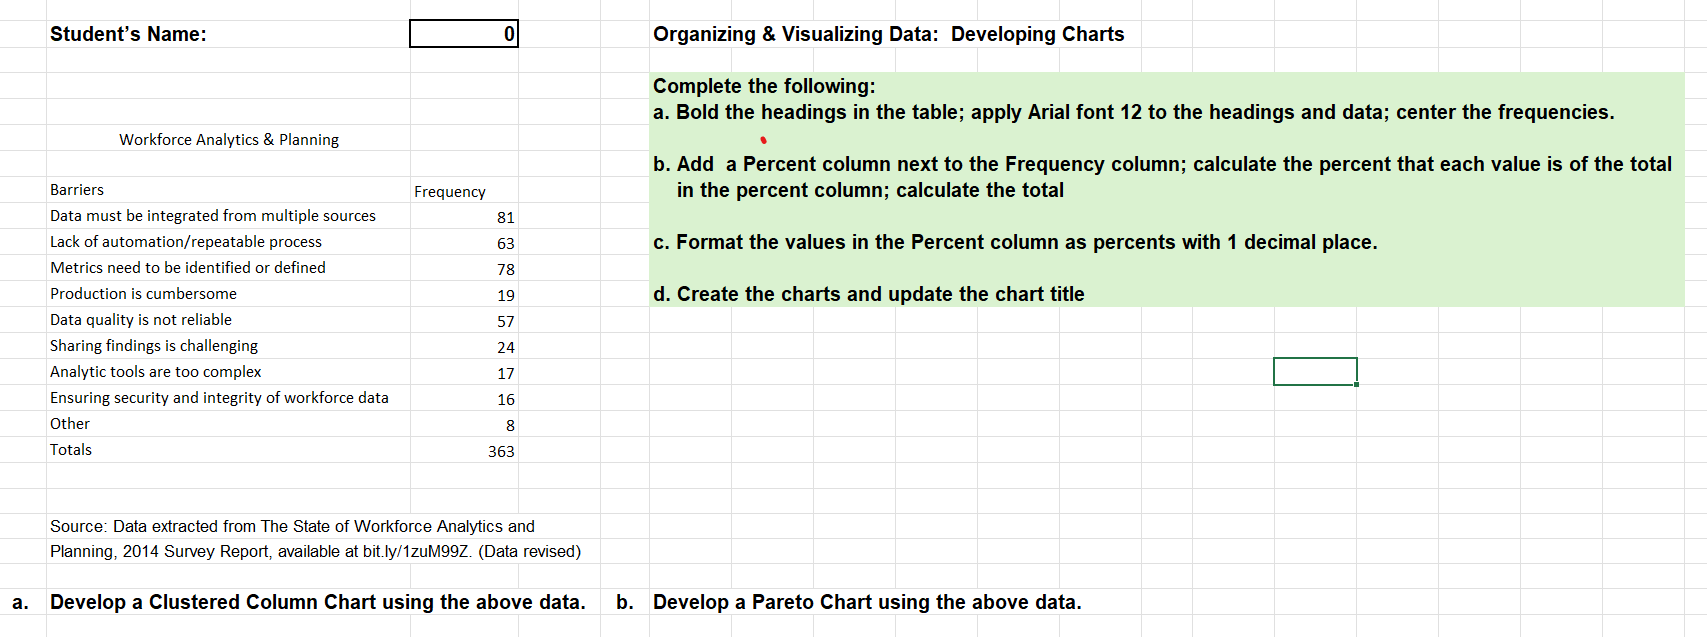
Workforce Analytics & Planning
Barriers
Data must be integrated from multiple sources
Lack of automationrepeatable process
Metrics need to be identified or defined
Production is cumbersome
Data quality is not reliable
Sharing findings is challenging
Analytic tools are too complex
Ensuring security and integrity of workforce data
Other
Totals
Source: Data extracted from The State of Workforce Analytics and
Planning, Survey Report, available at
bit.lyzuMZData revised
Organizing & Visualizing Data: Developing Charts
Complete the following:
a Bold the headings in the table; apply Arial font to the headings and data; center the frequencies.
b Add a Percent column next to the Frequency column; calculate the percent that each value is of the total
in the percent column; calculate the total
c Format the values in the Percent column as percents with decimal place.
d Create the charts and update the chart title
a Develop a Clustered Column Chart using the above data.
b Develop a Pareto Chart using the above data.
Step by Step Solution
There are 3 Steps involved in it
1 Expert Approved Answer
Step: 1 Unlock

Question Has Been Solved by an Expert!
Get step-by-step solutions from verified subject matter experts
Step: 2 Unlock
Step: 3 Unlock